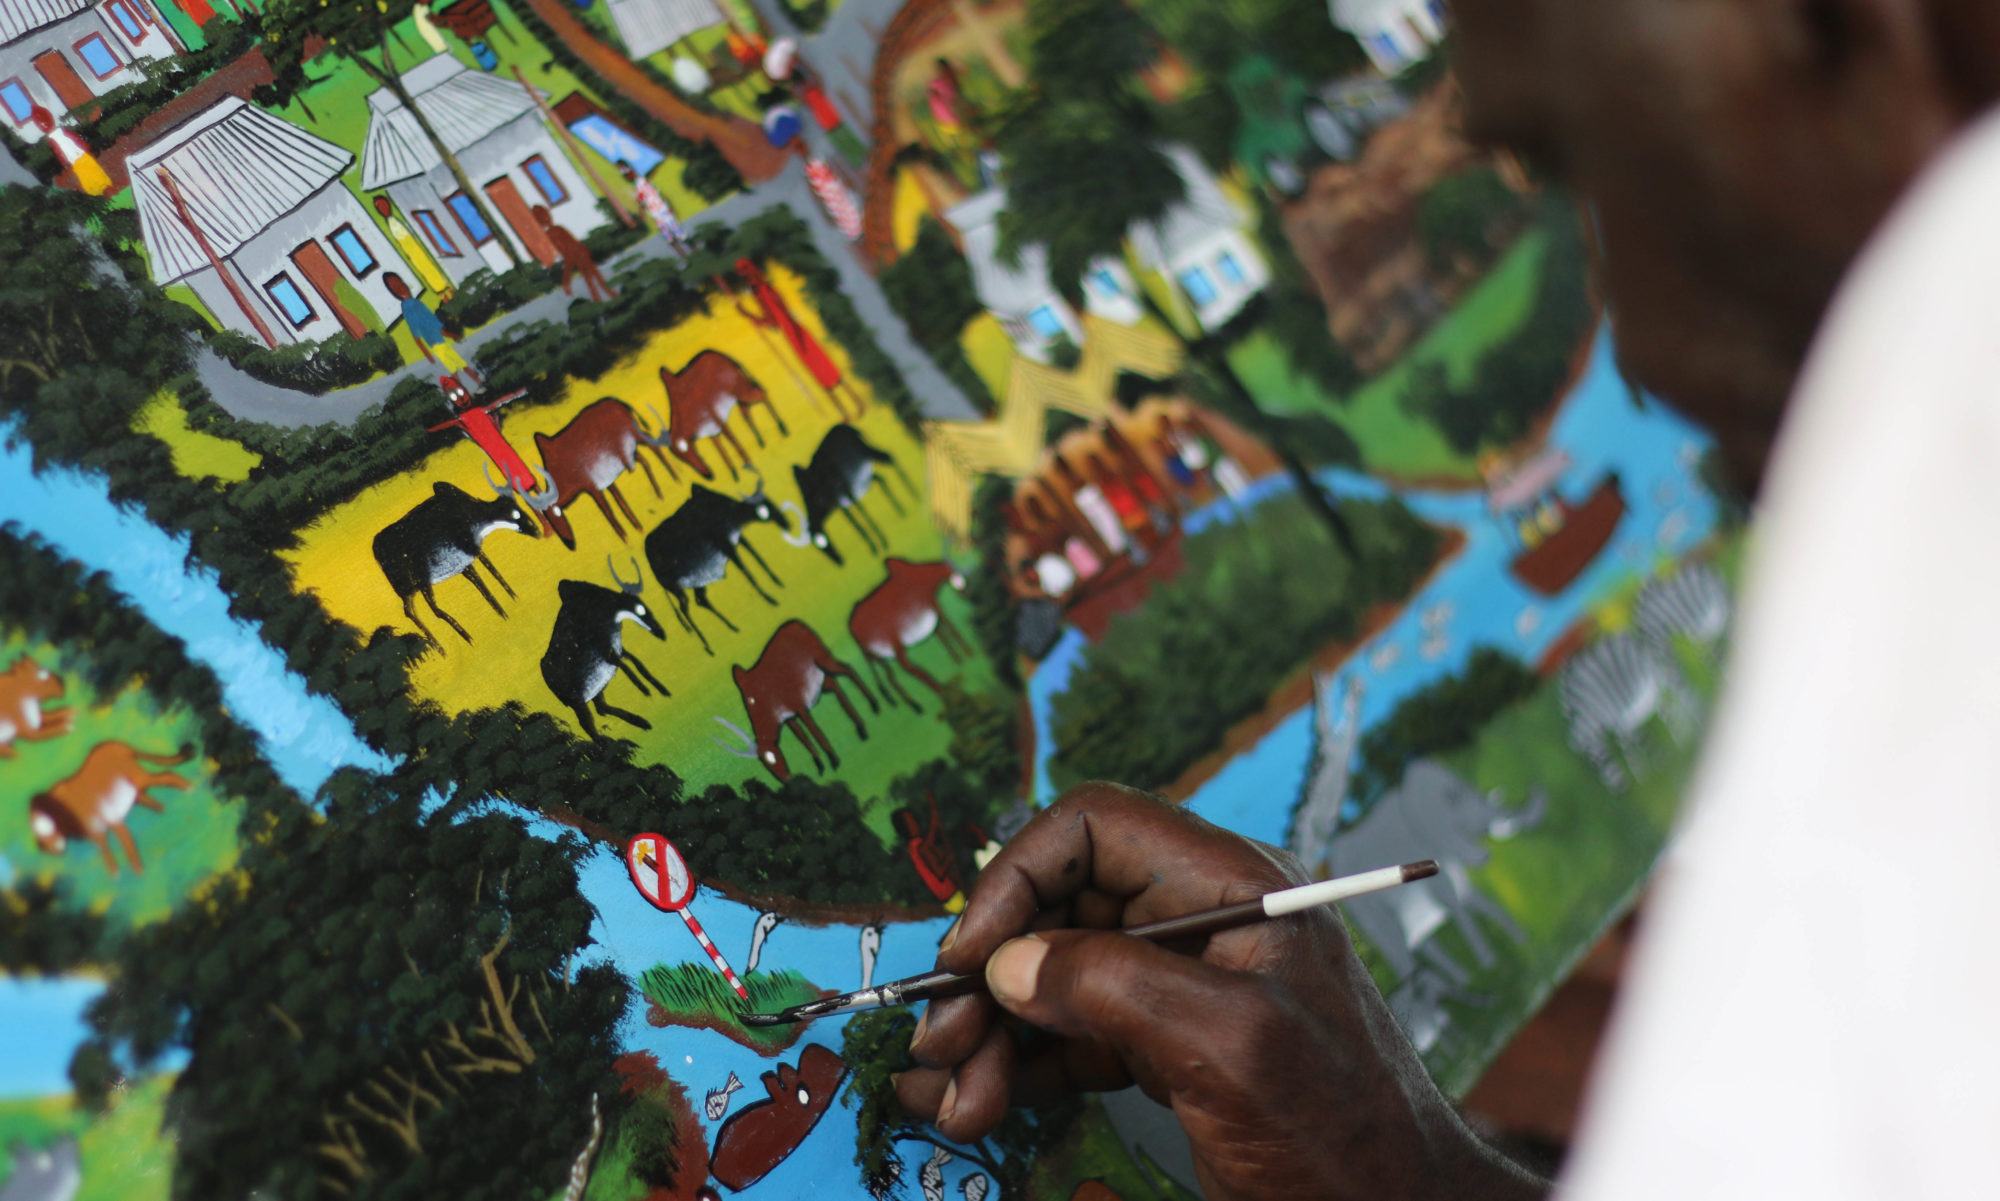
I have a particular interest of visualizing science as graphs, maps, paintings, and even stop-motion movies. A nice illustration is such a good and efficient way to catch someone’s attention and communicate your scientific results.
I am currently part time freelancing as a science illustrator, so if you need help with tables, charts, figures, maps, or other visualizations, don’t hesitate to contact me (emmalijohansson@gmail.com).
Below are a selection of figures and videos that I have made for my own research, and for others.
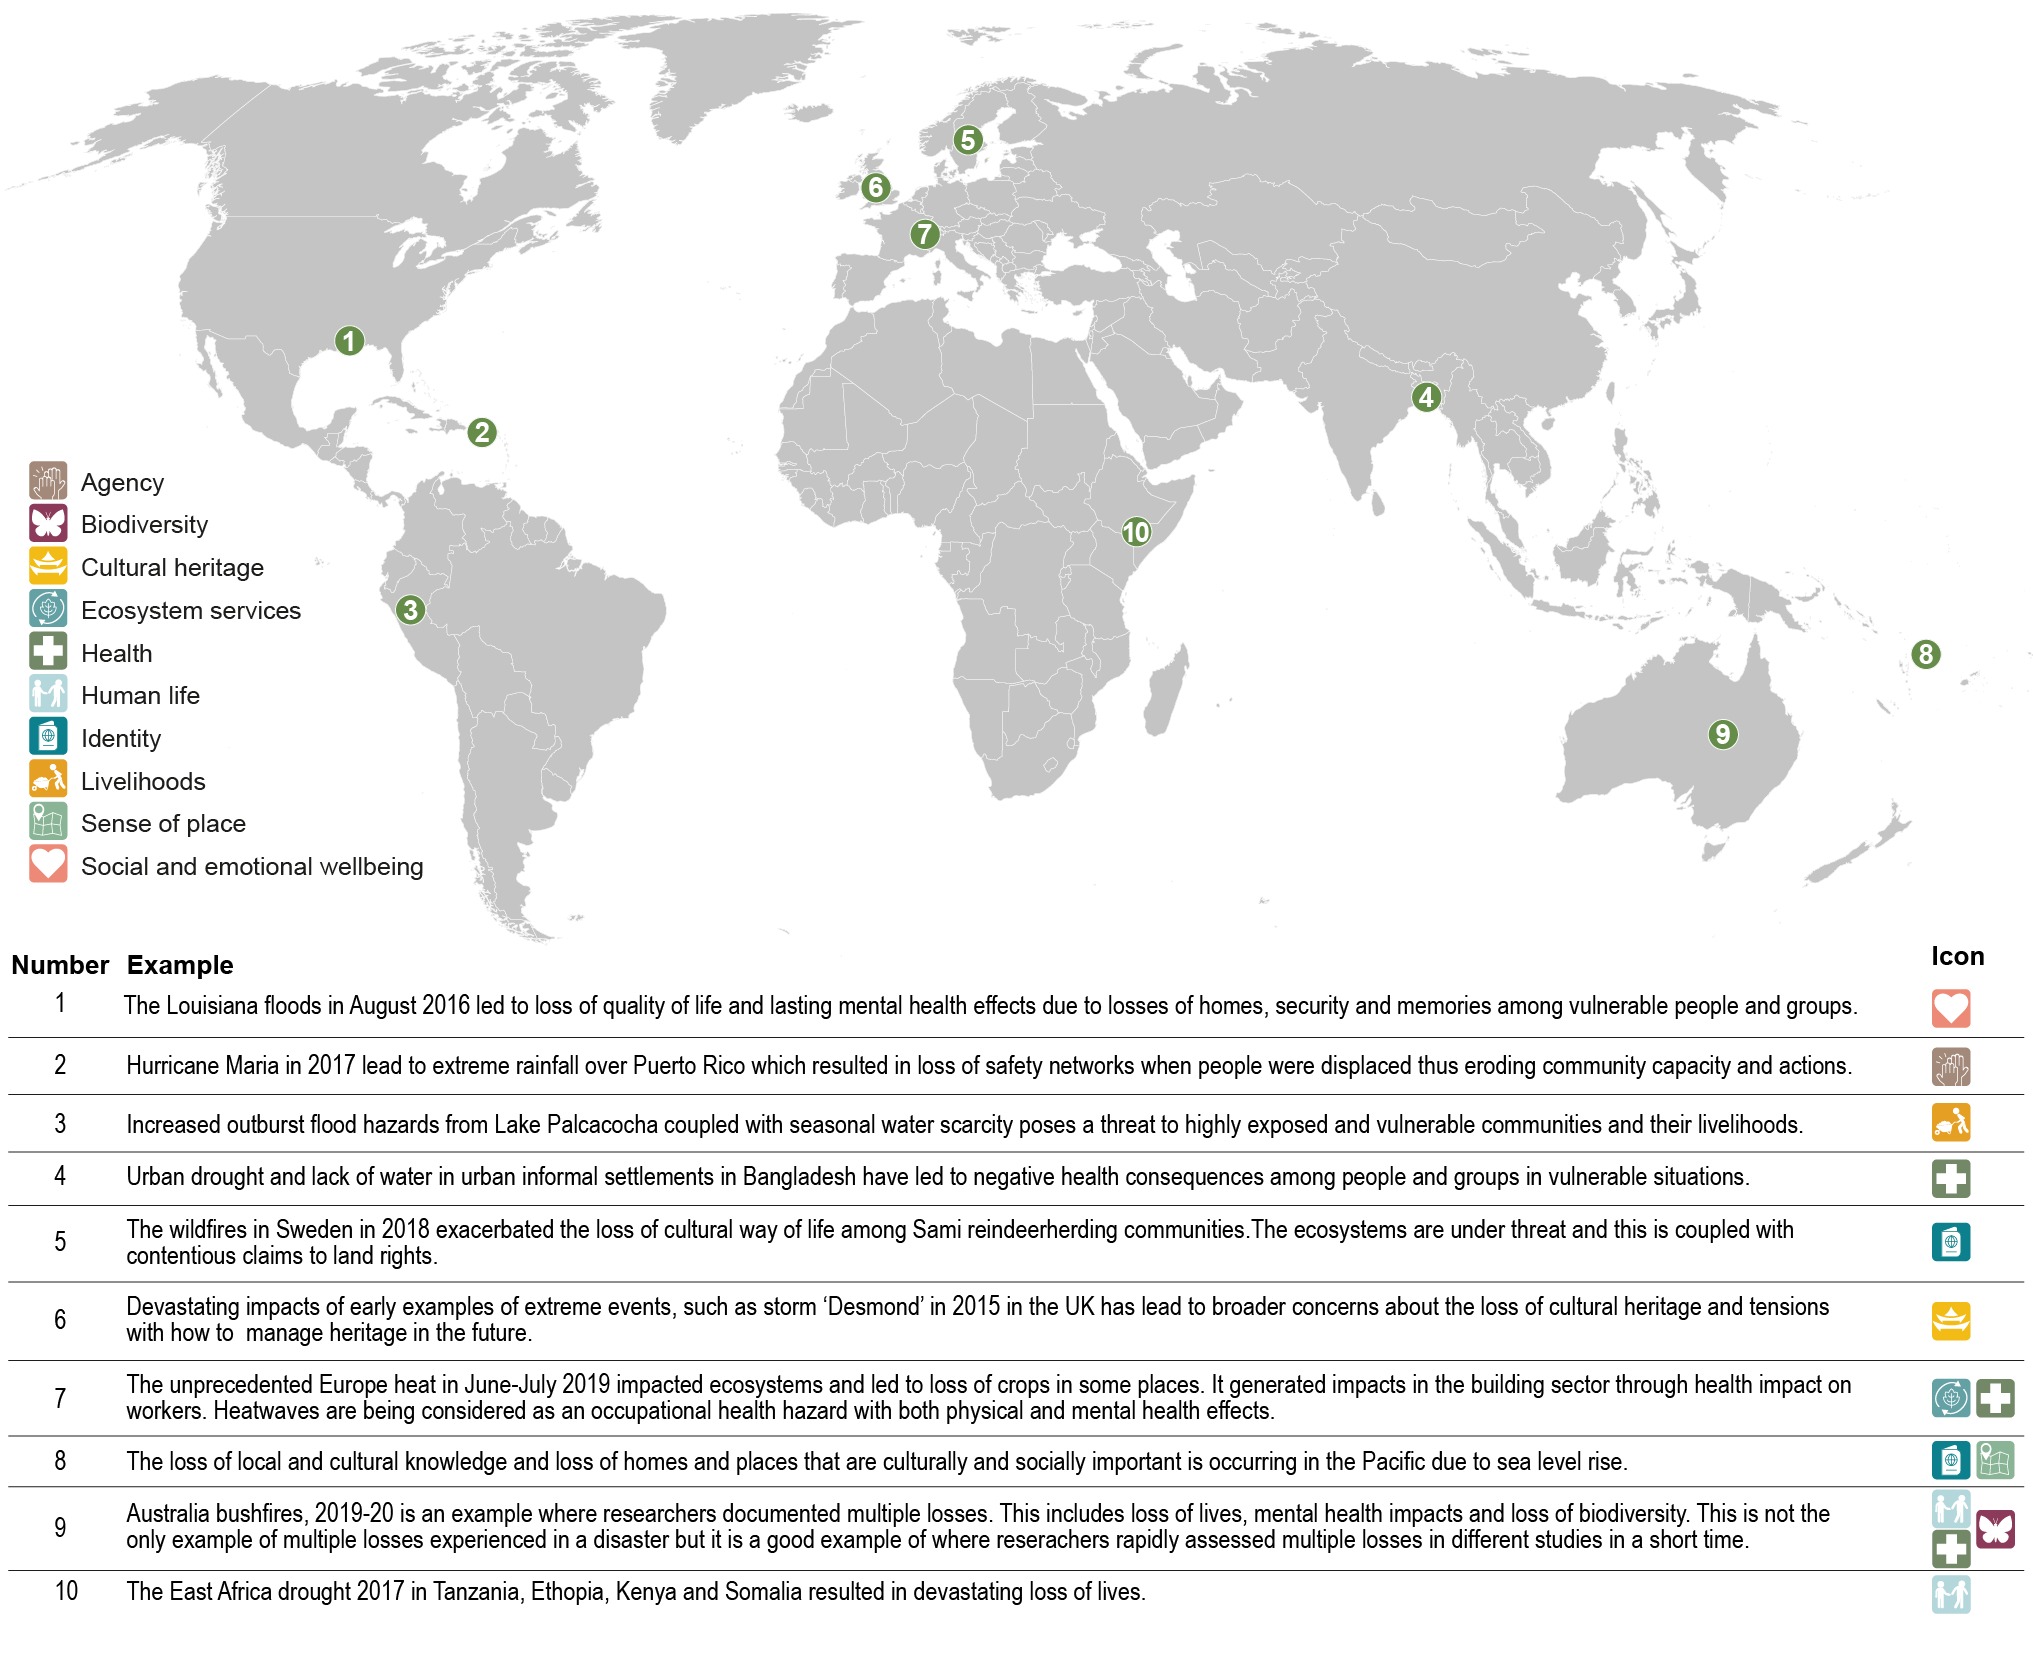
Figure for the “Poverty, Livelihoods and Sustainable Development” chapter in: Climate Change 2022: Impacts, Adaptation and Vulnerability. Contribution of Working Group II to the Sixth Assessment Report of the Intergovernmental Panel on Climate Change.
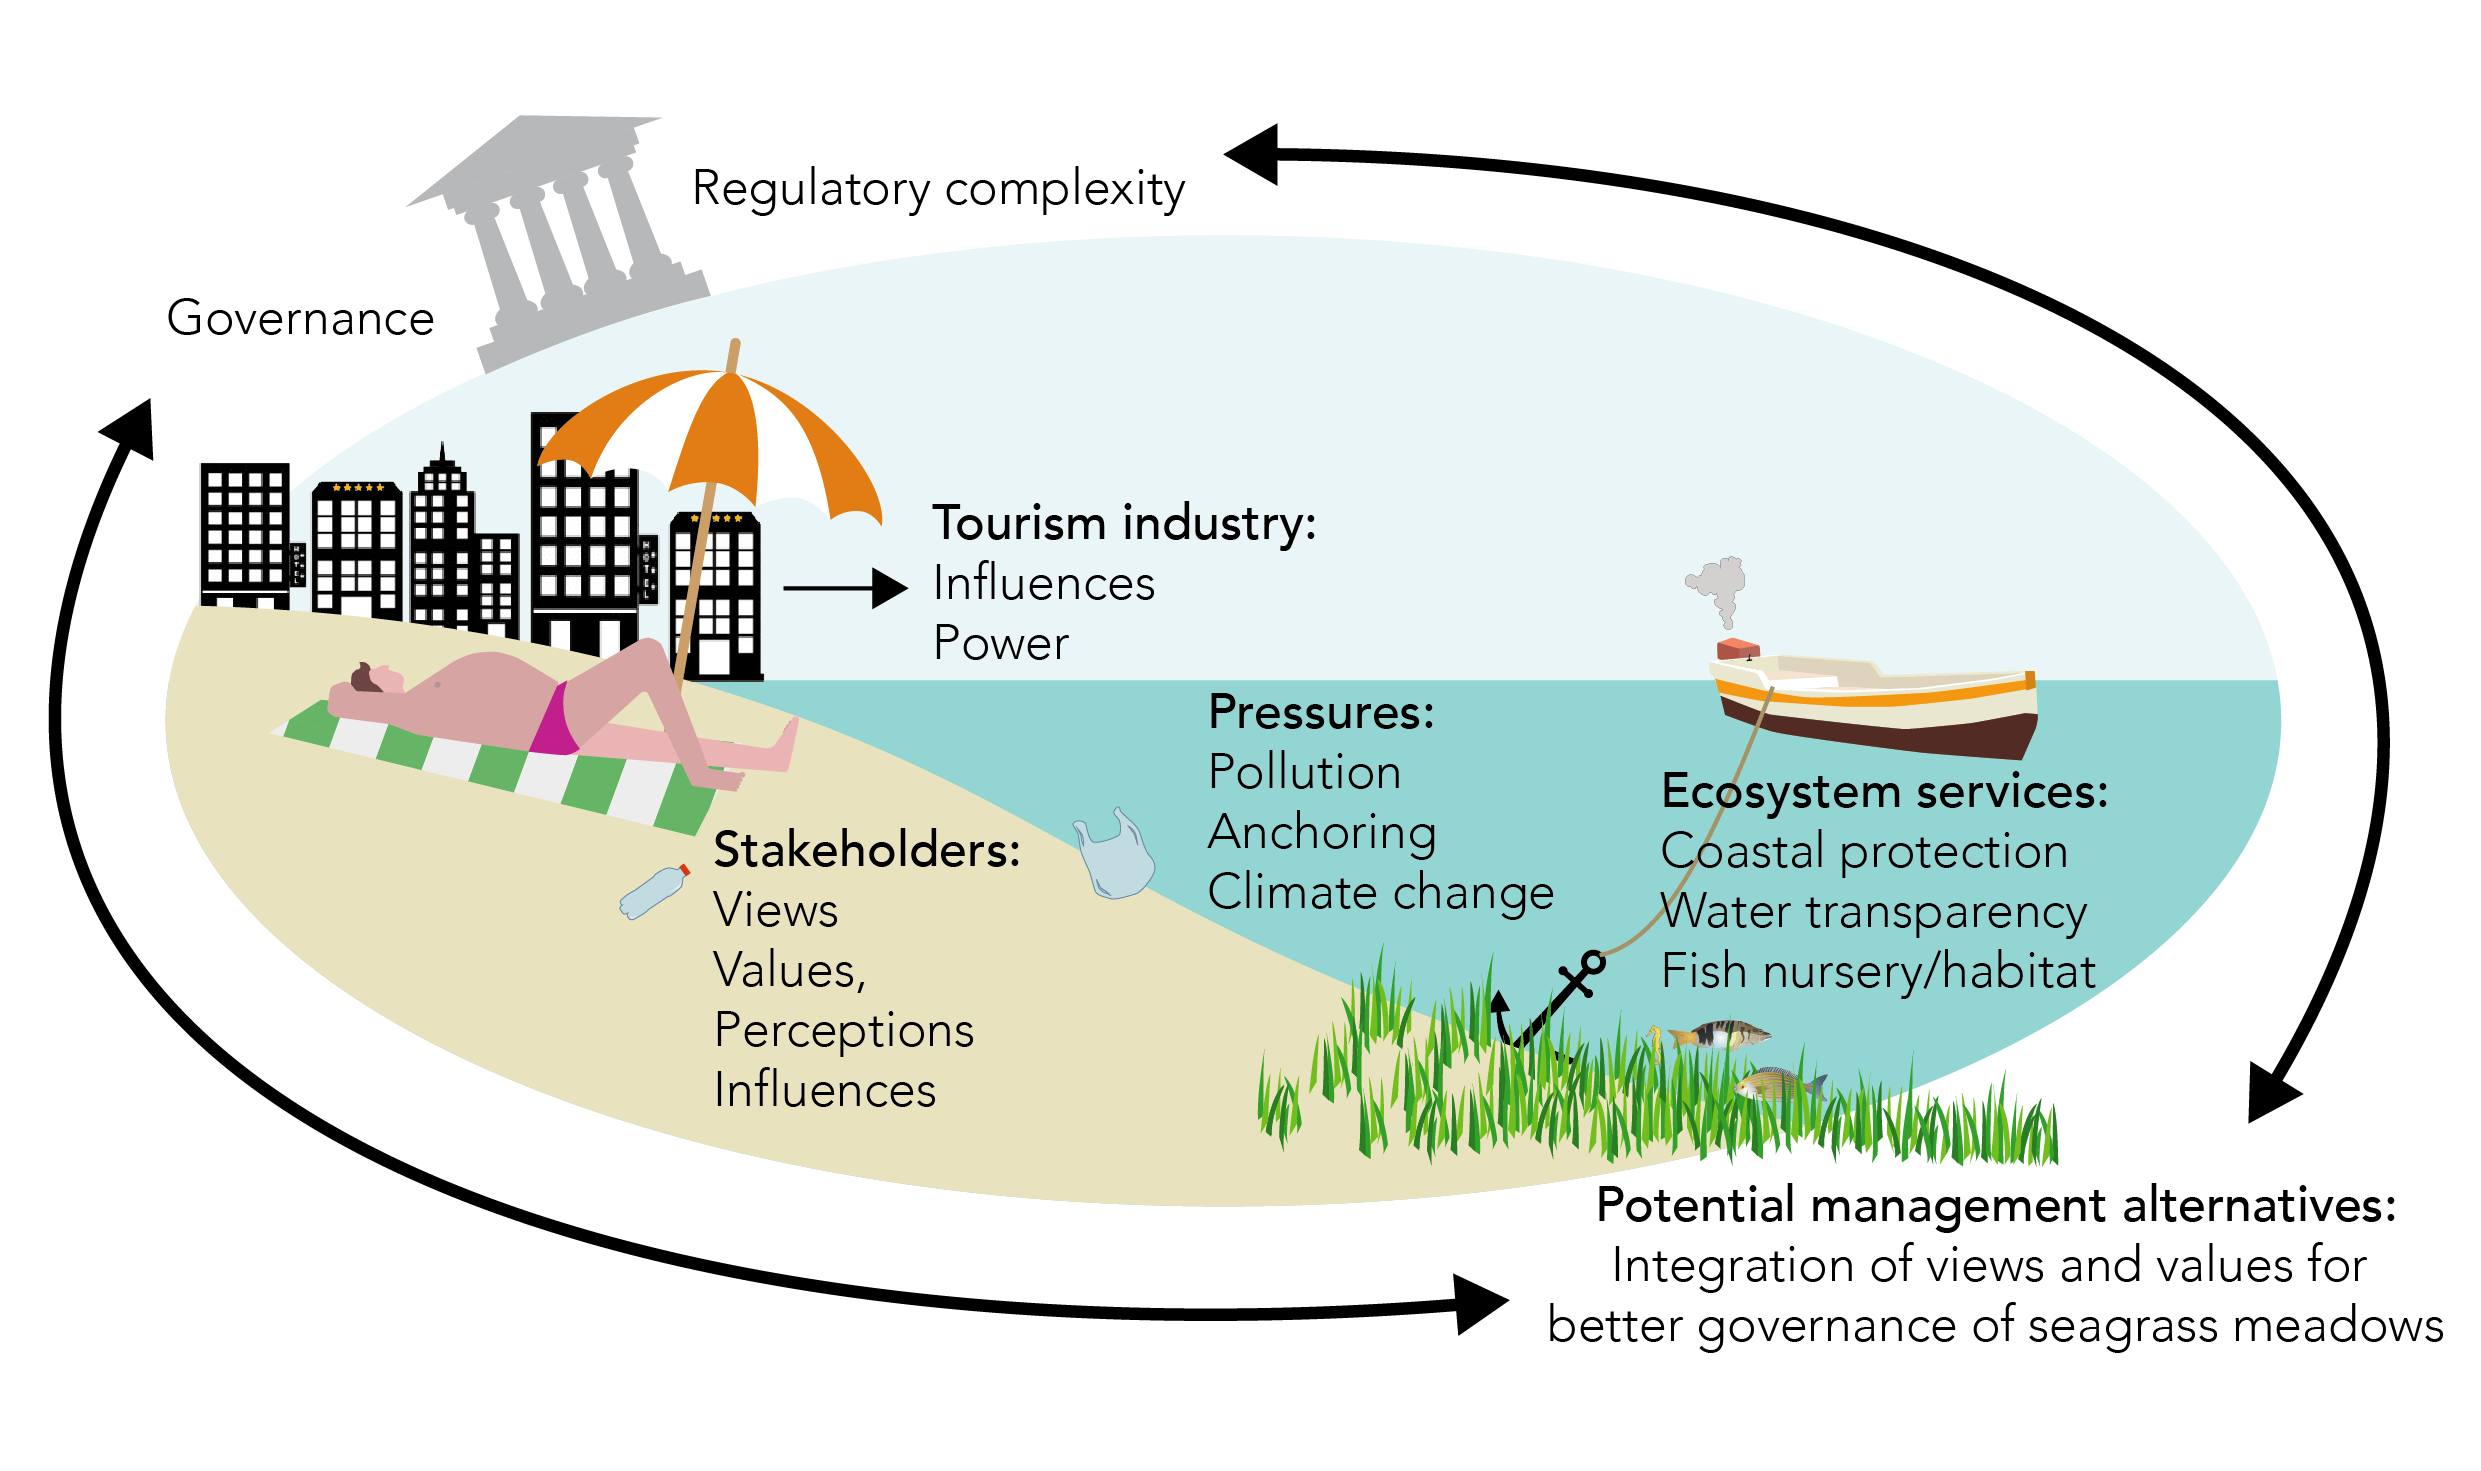
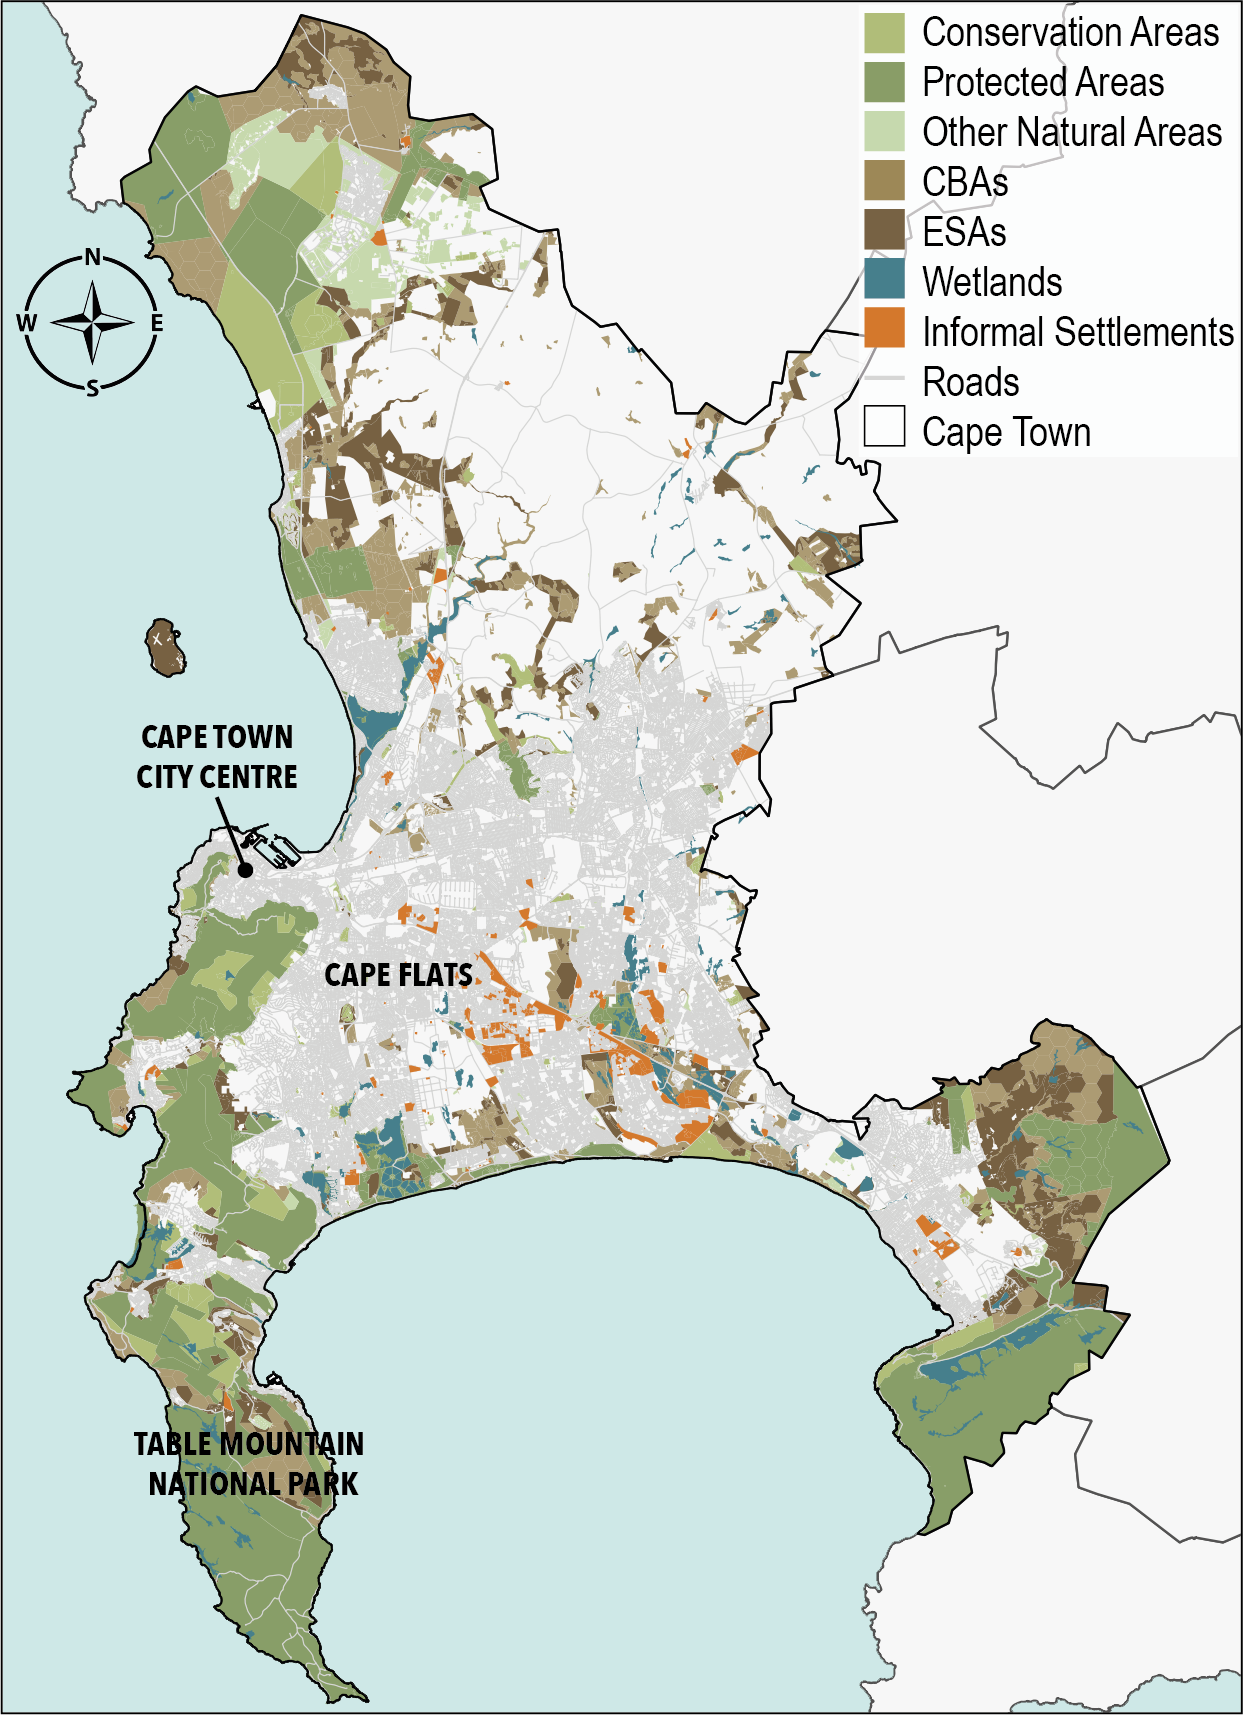
Boyd, E., Chaffin, B., Dorkenoo, K., Jackson, G., Harrington, L., N’guetta, A., Johansson, E., Nordlander, L., De Rosa, S. P., Raju, E., Scown, M., Soo, J. & Stuart-Smith, R. (2021). “Loss and damage from climate change: A new climate justice agenda“. One Earth, 4(10) p. 1365-1370.Map of Cape Town for article published in Ecosystem Services (Stålhammar, 2021)
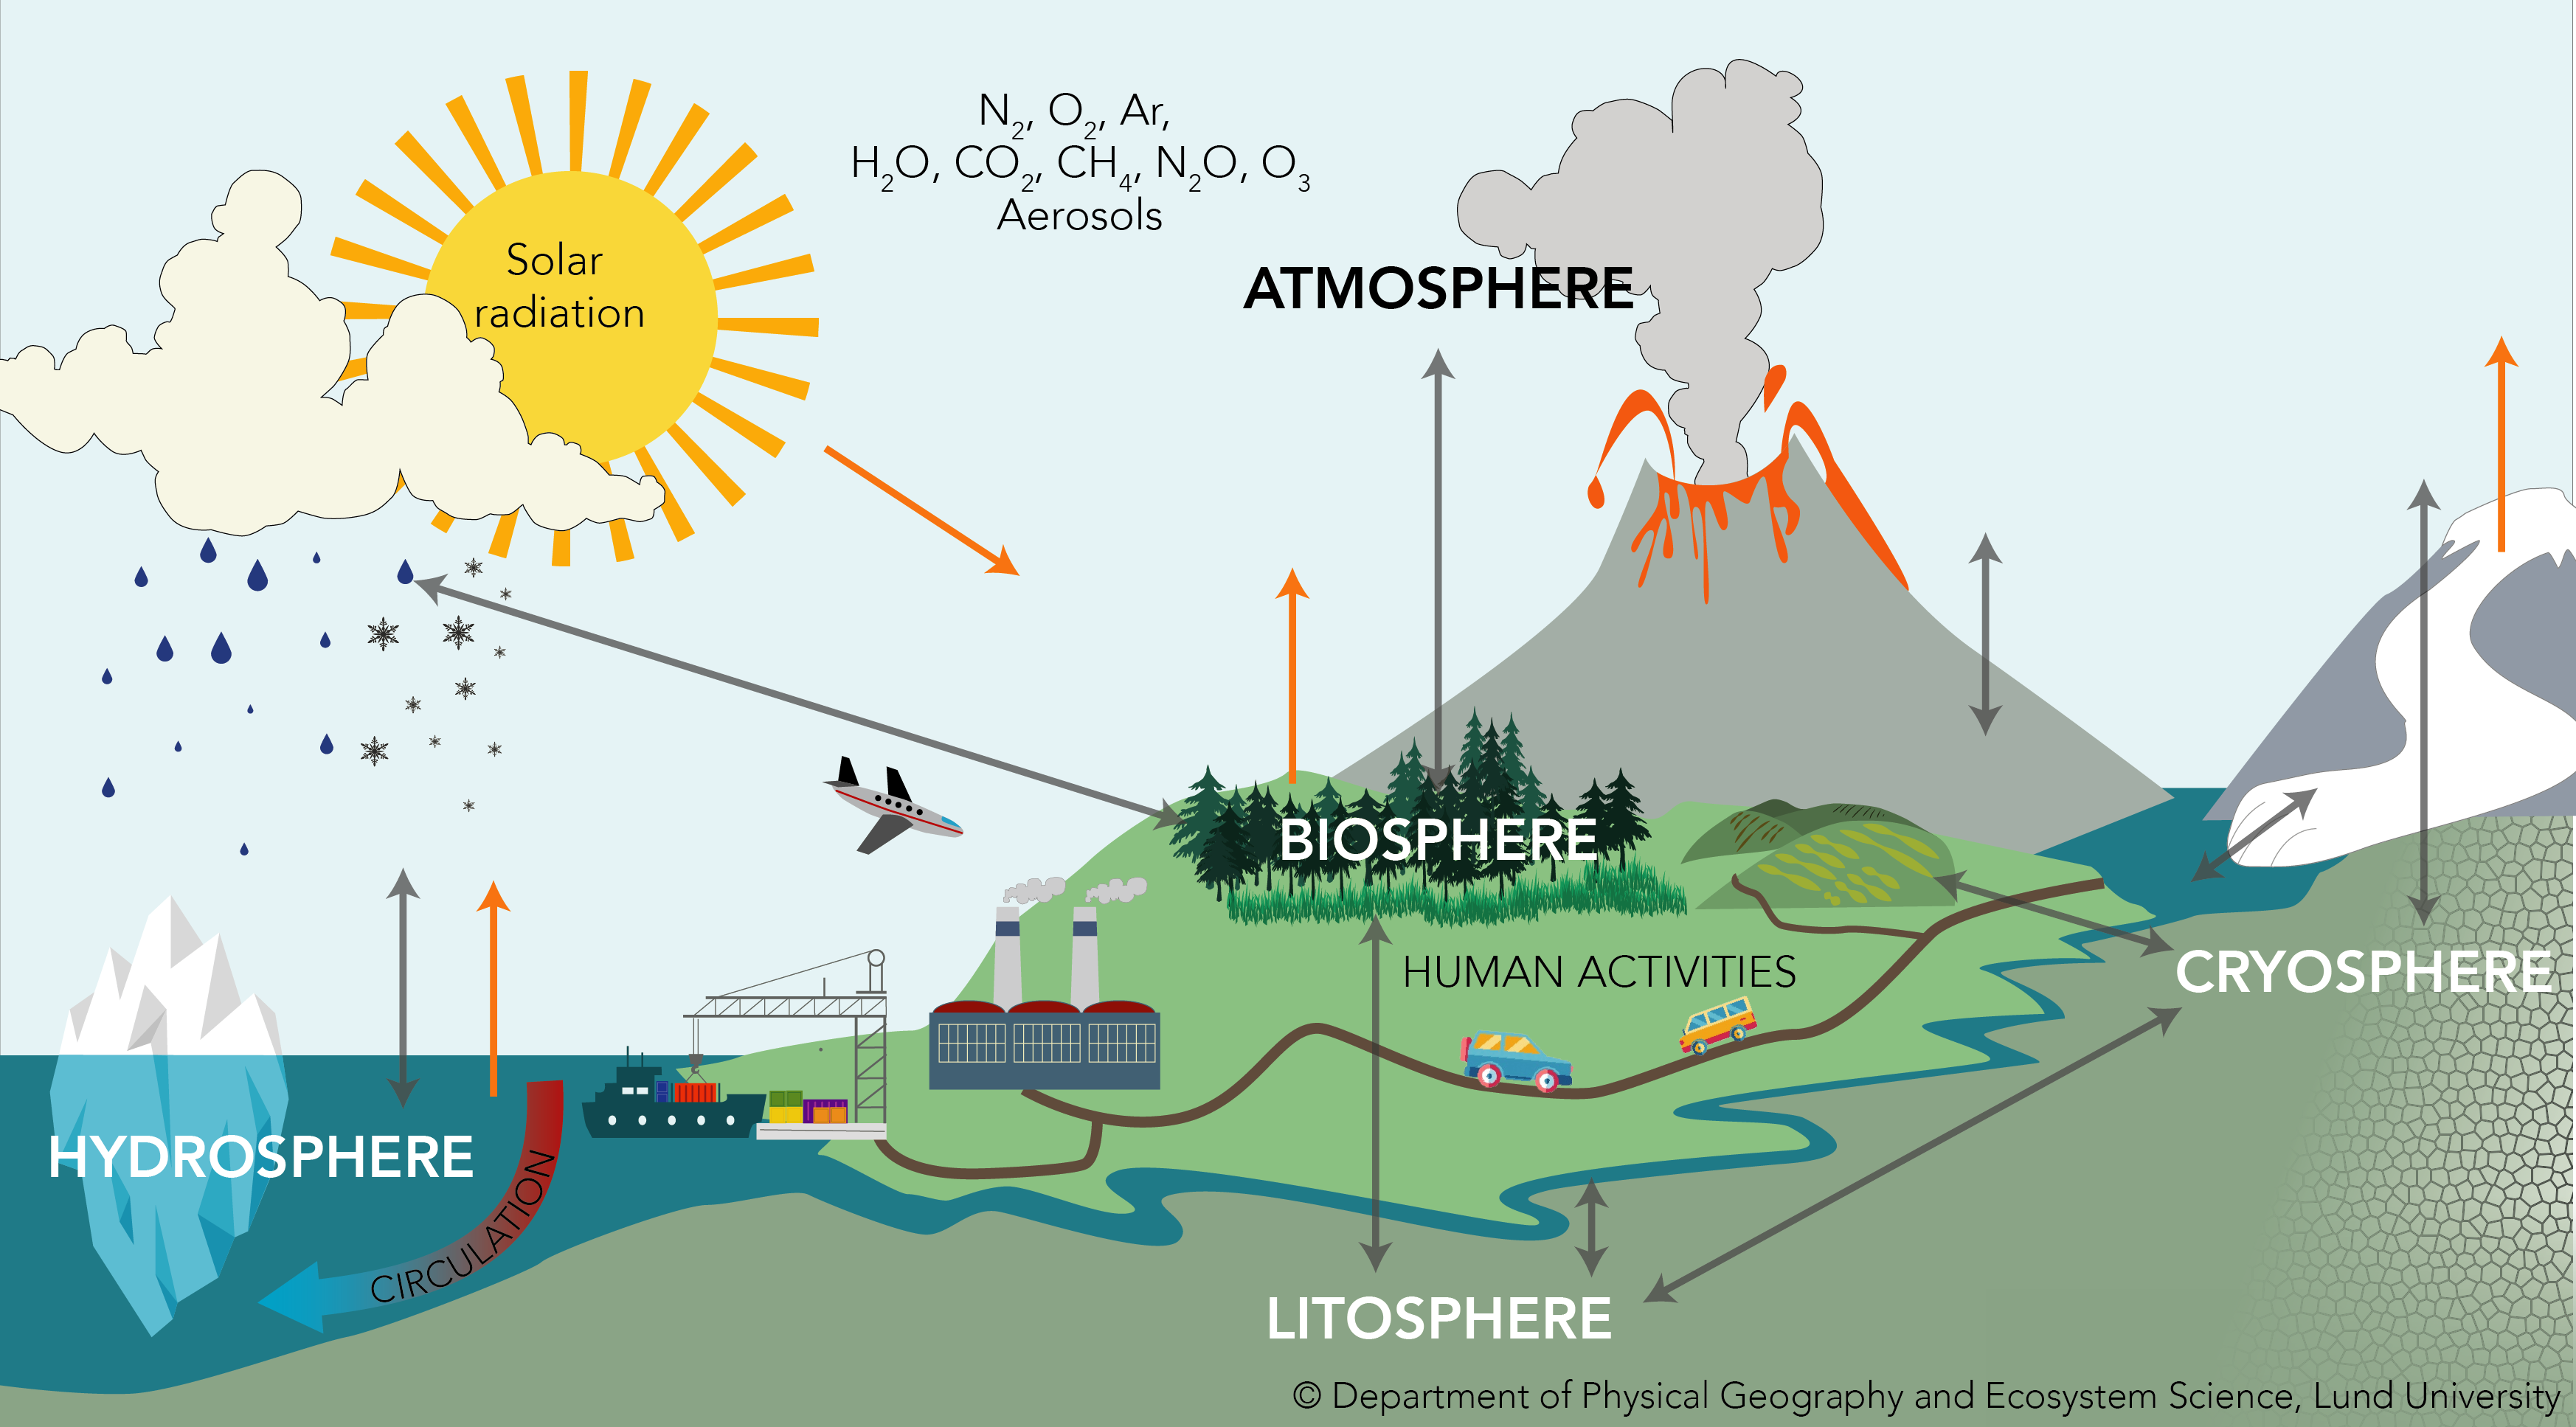
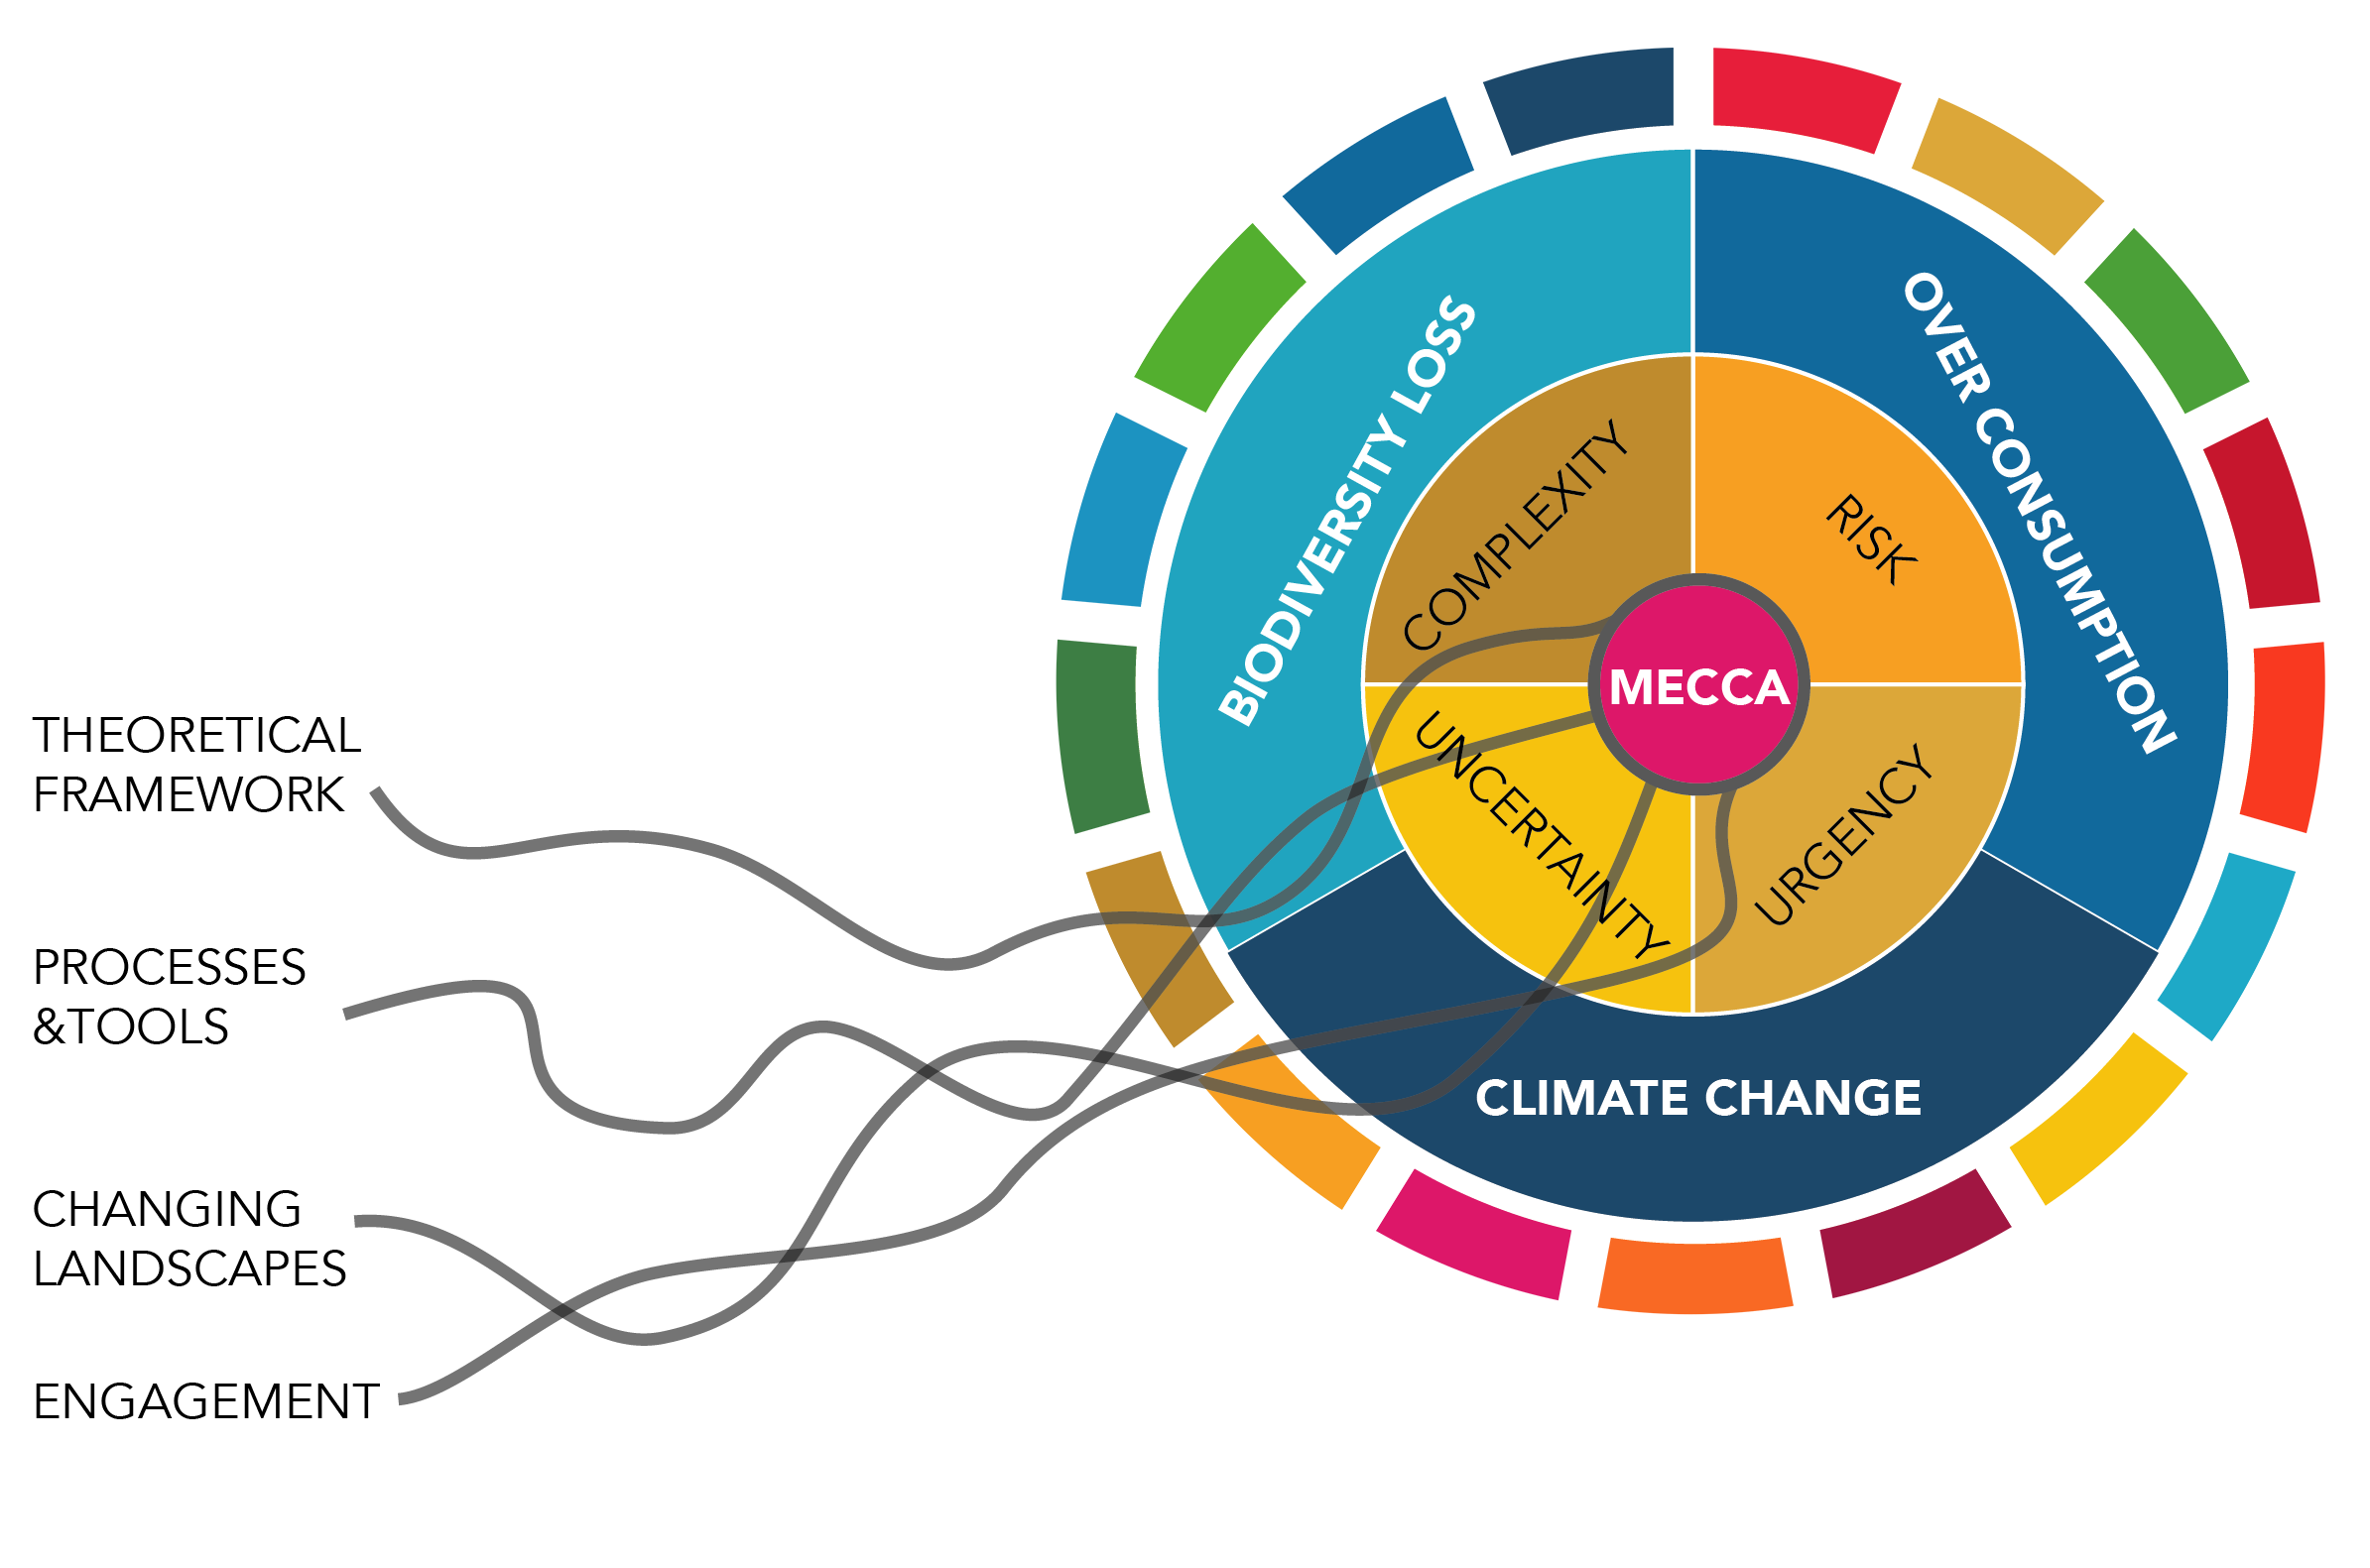
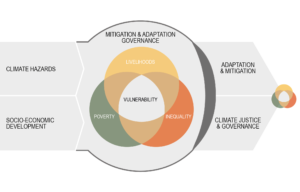
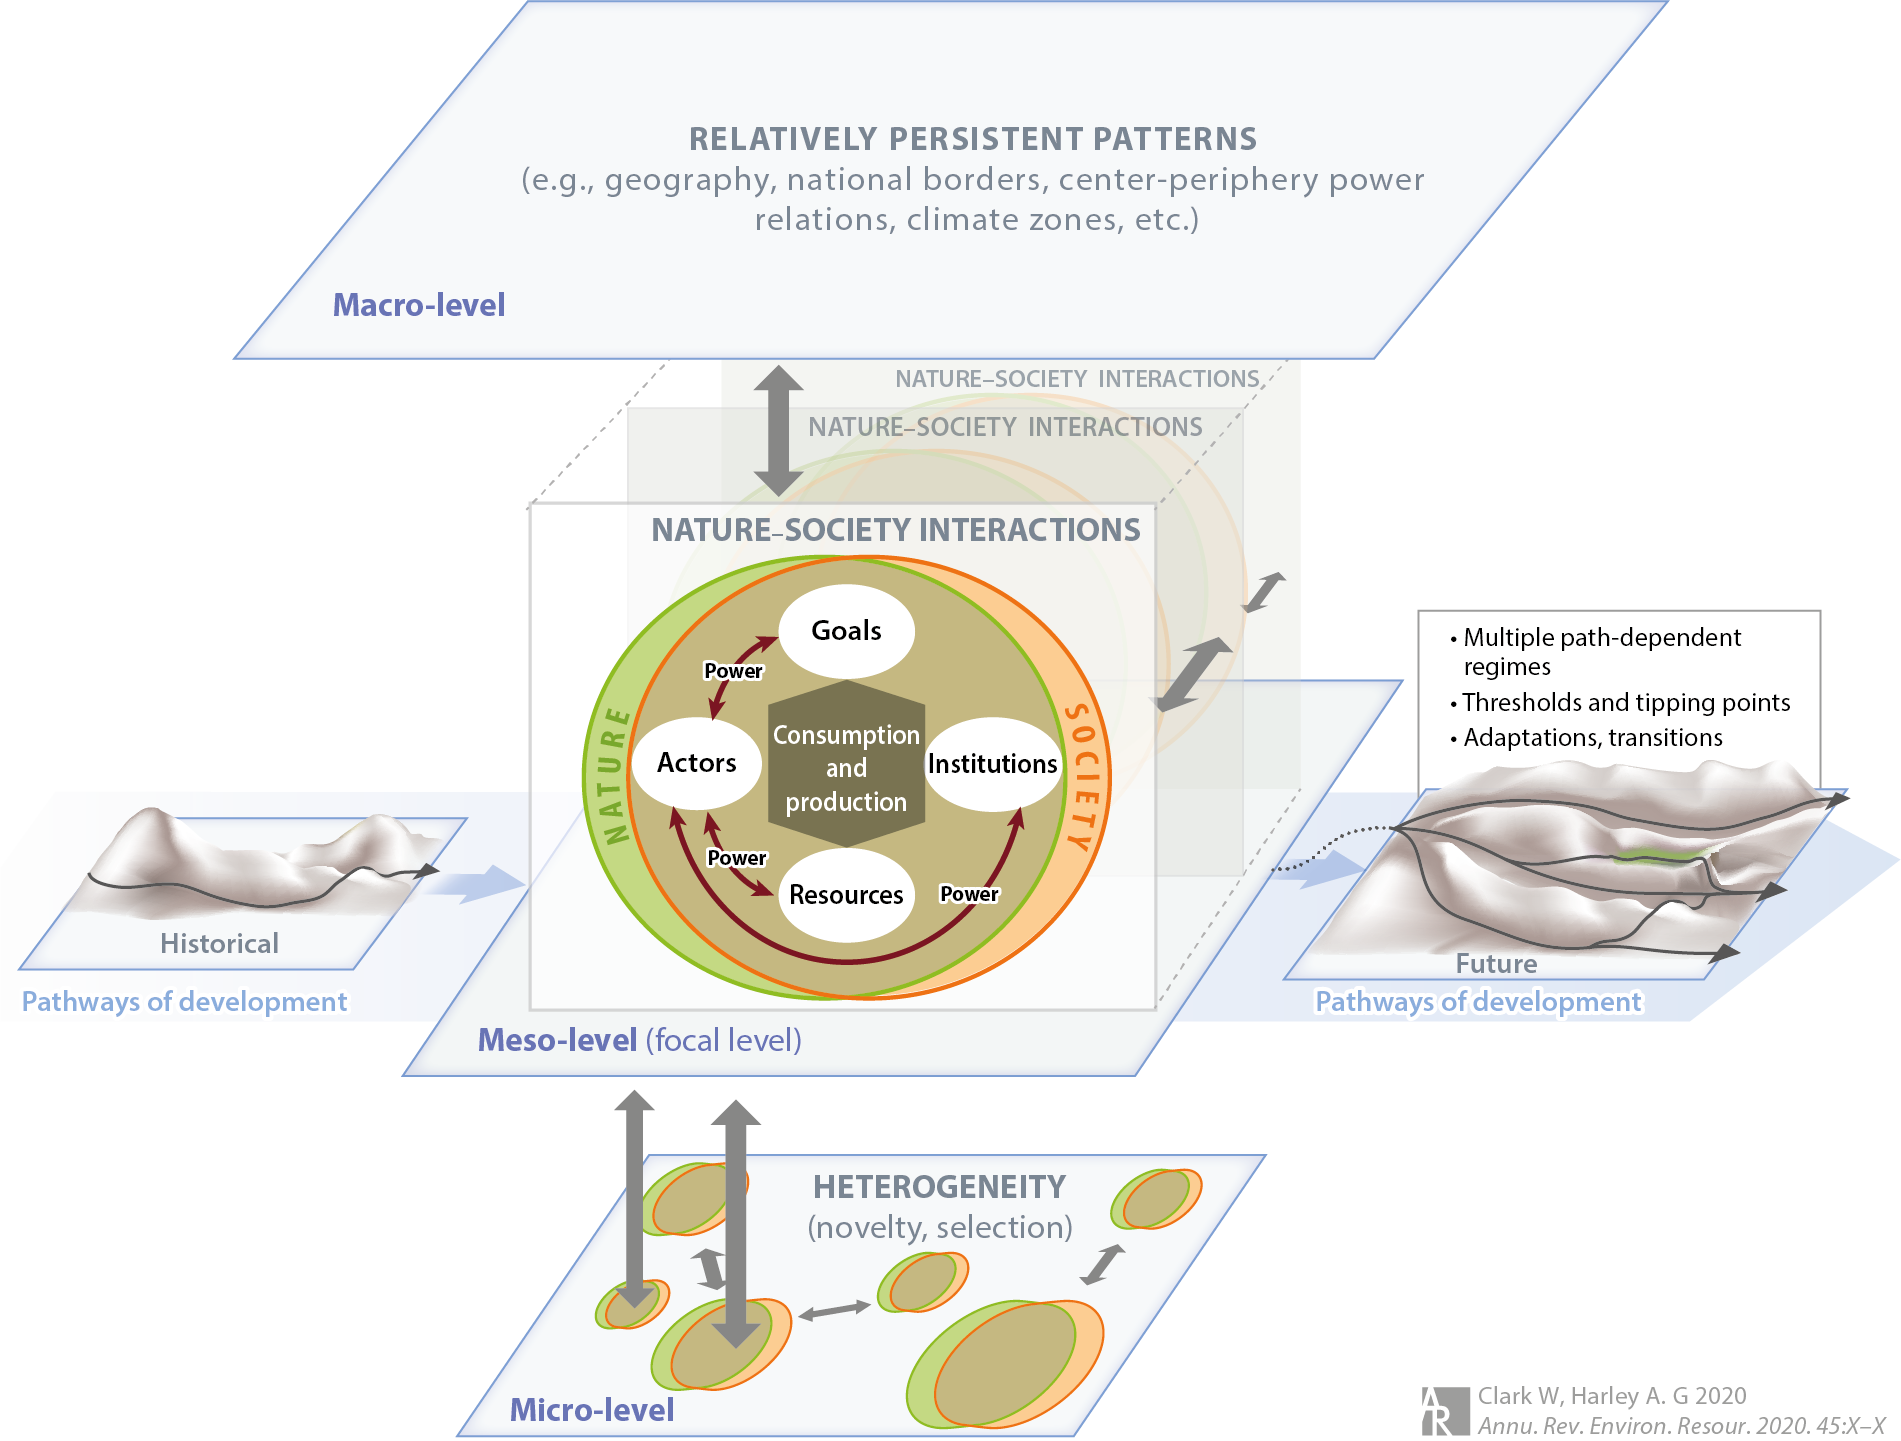
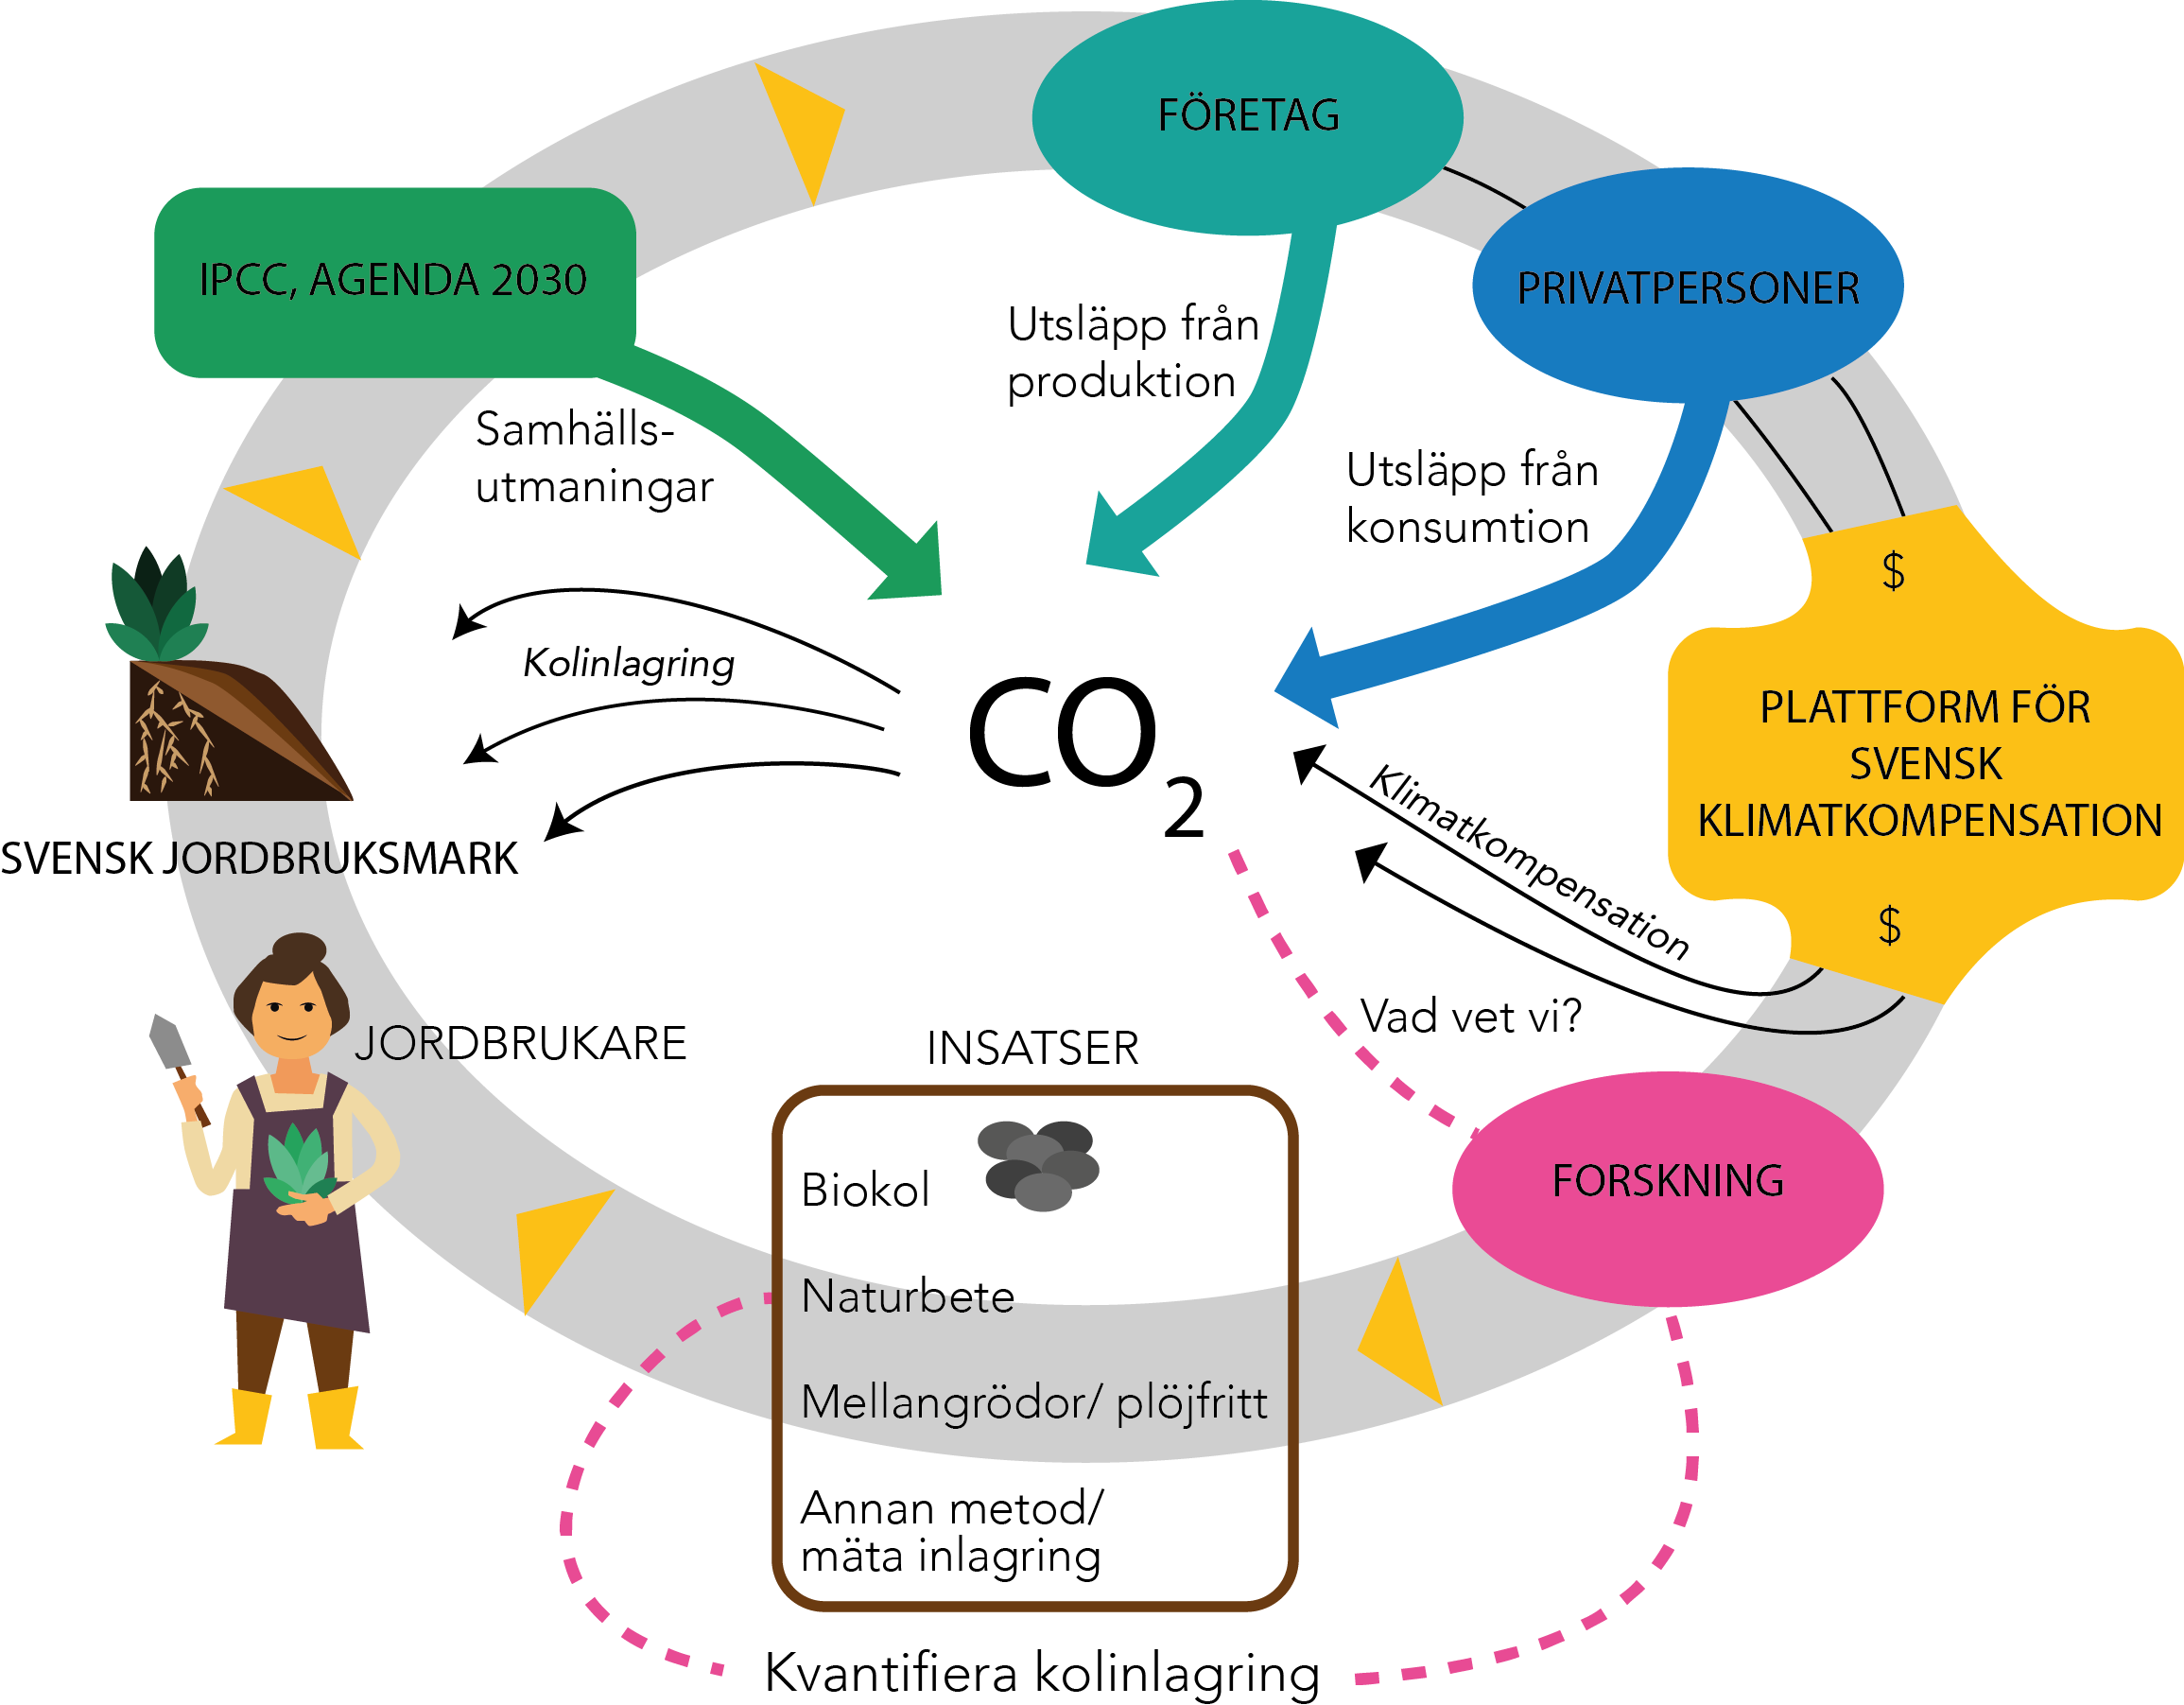
Conceptual figure for project proposal. Conceptual figure for project proposal.
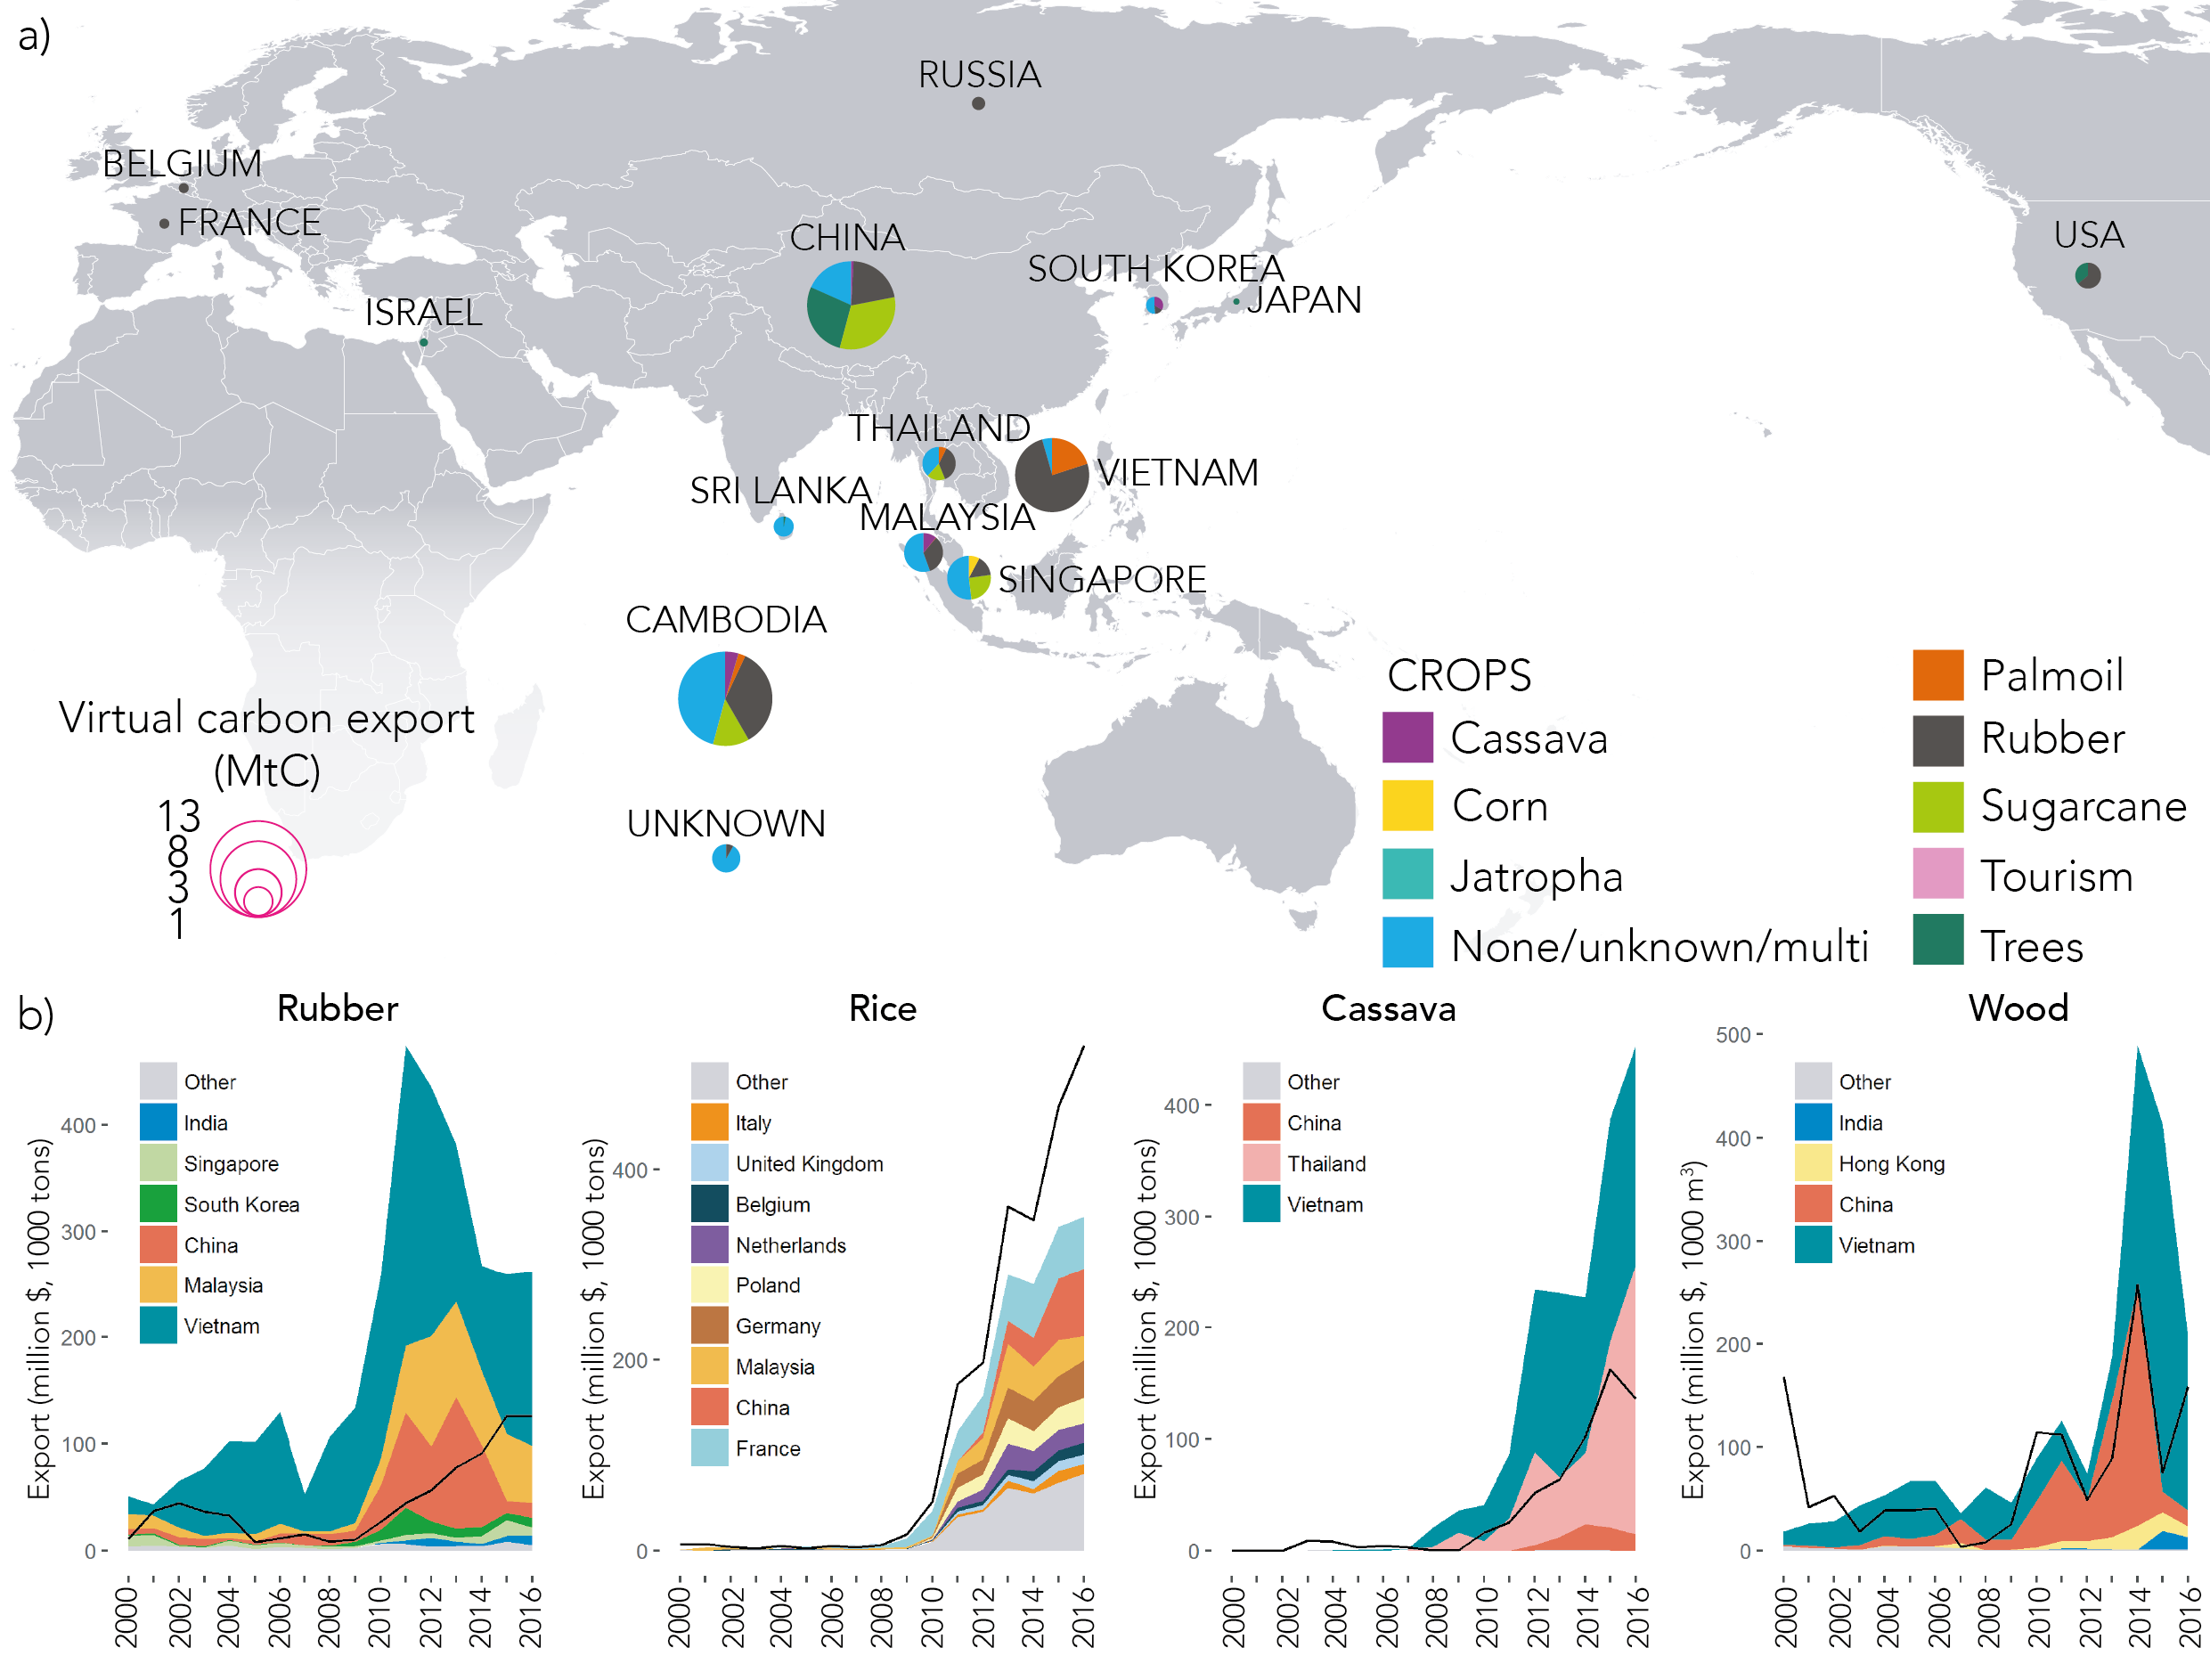
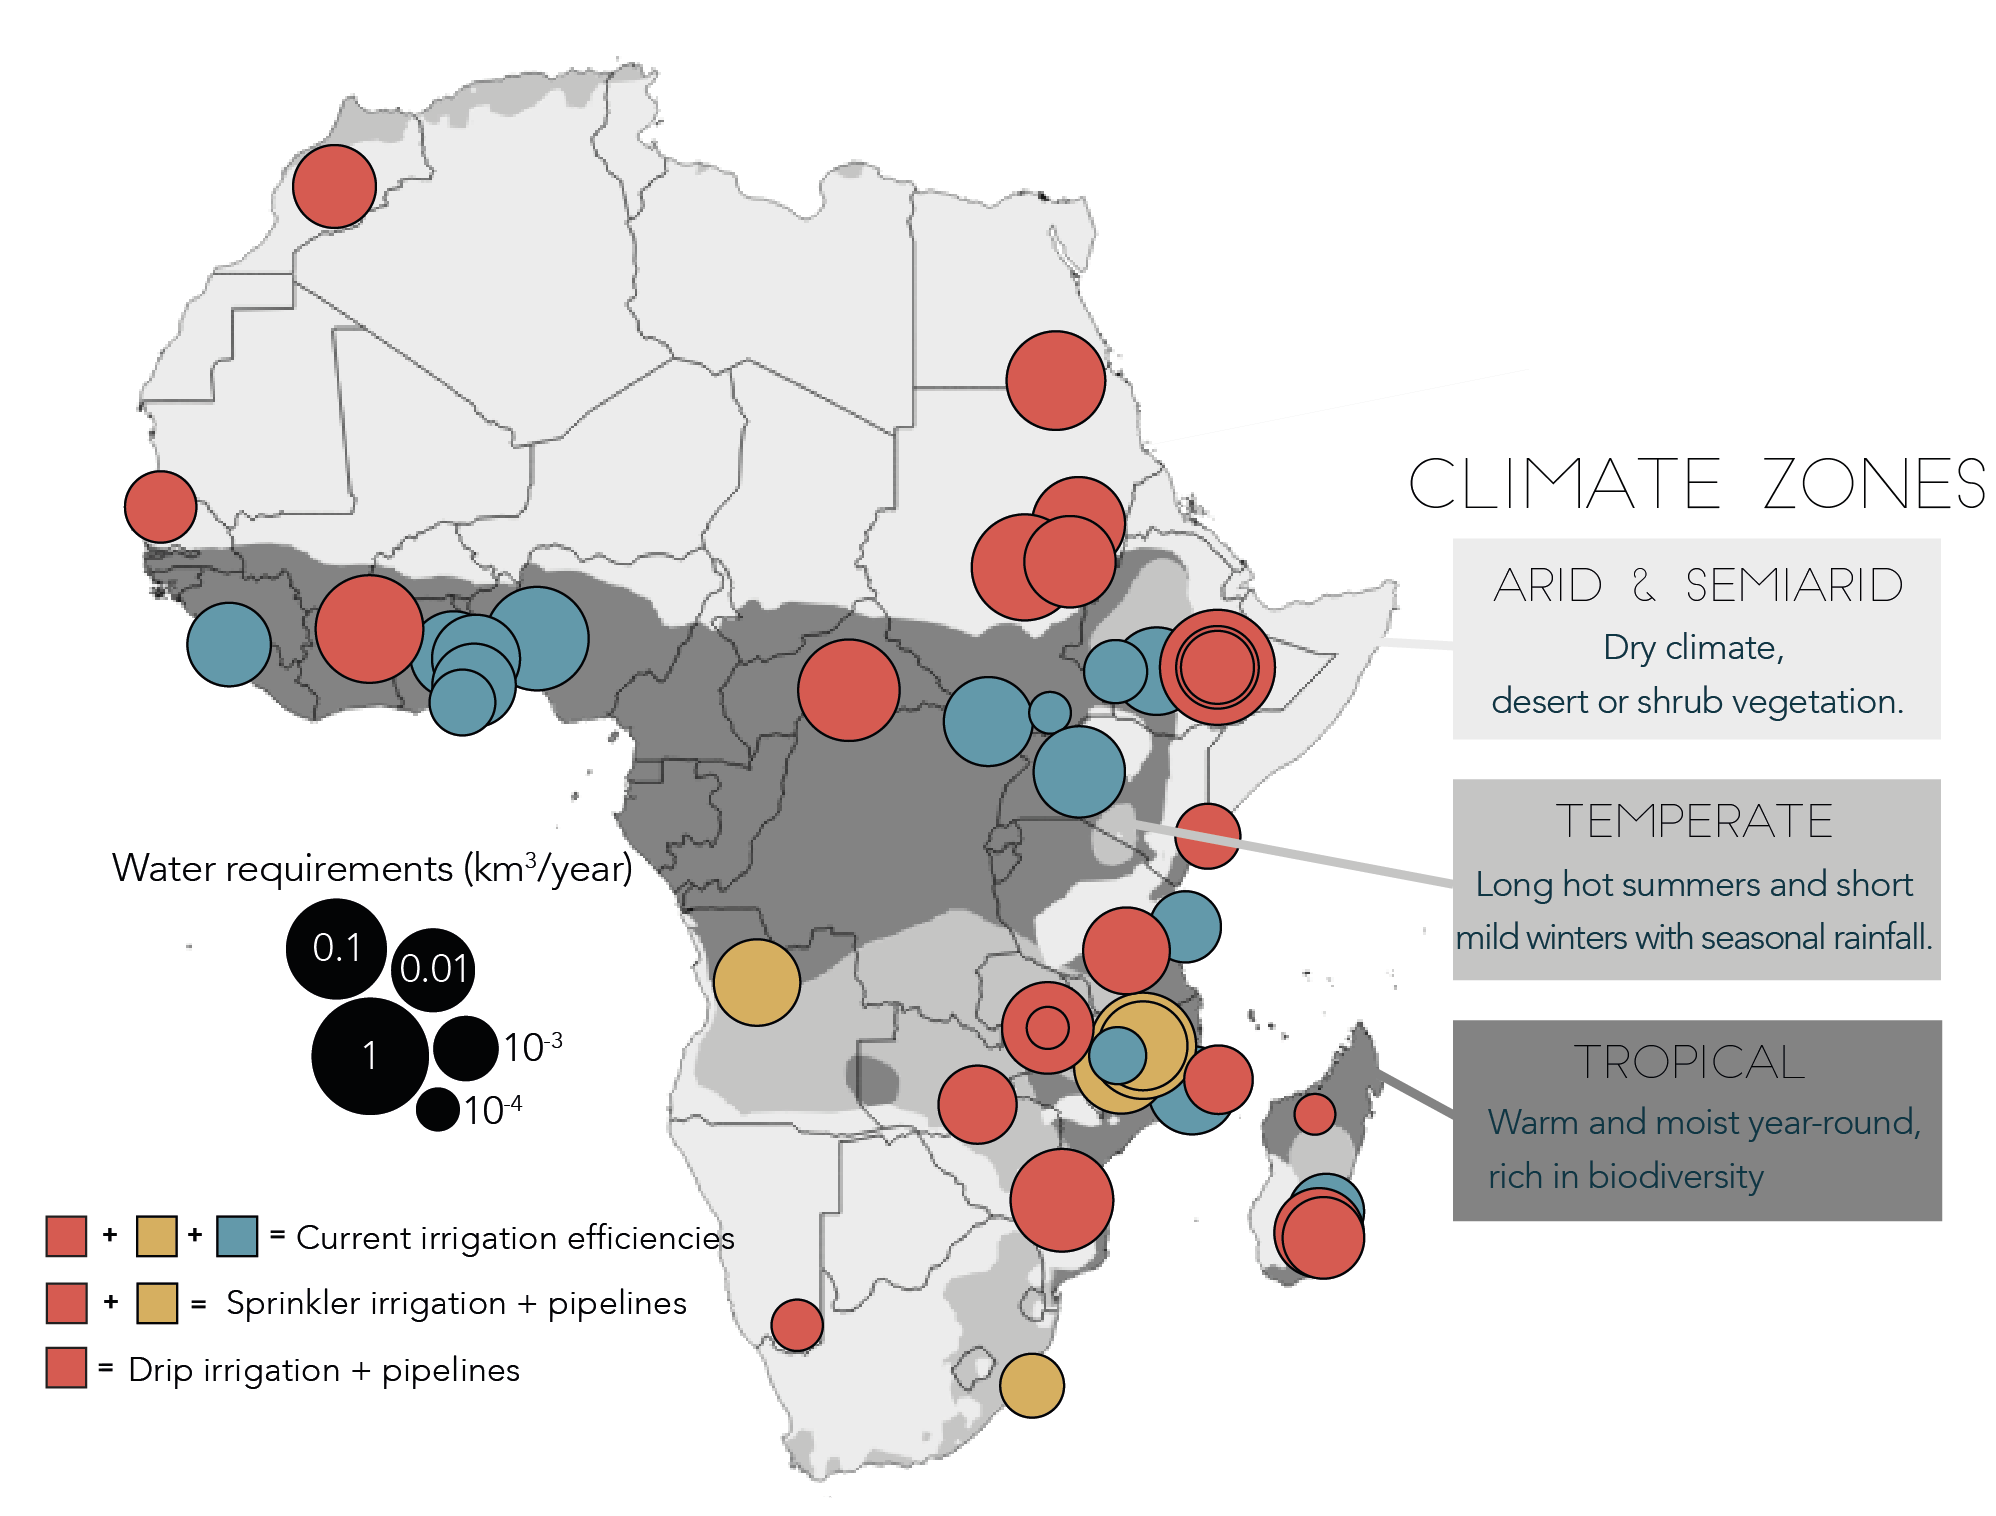
Areas at high risk of water conflicts due to land grabs, based on crops planted and irrigation technique. Figure modified from Johansson et al. 2016.
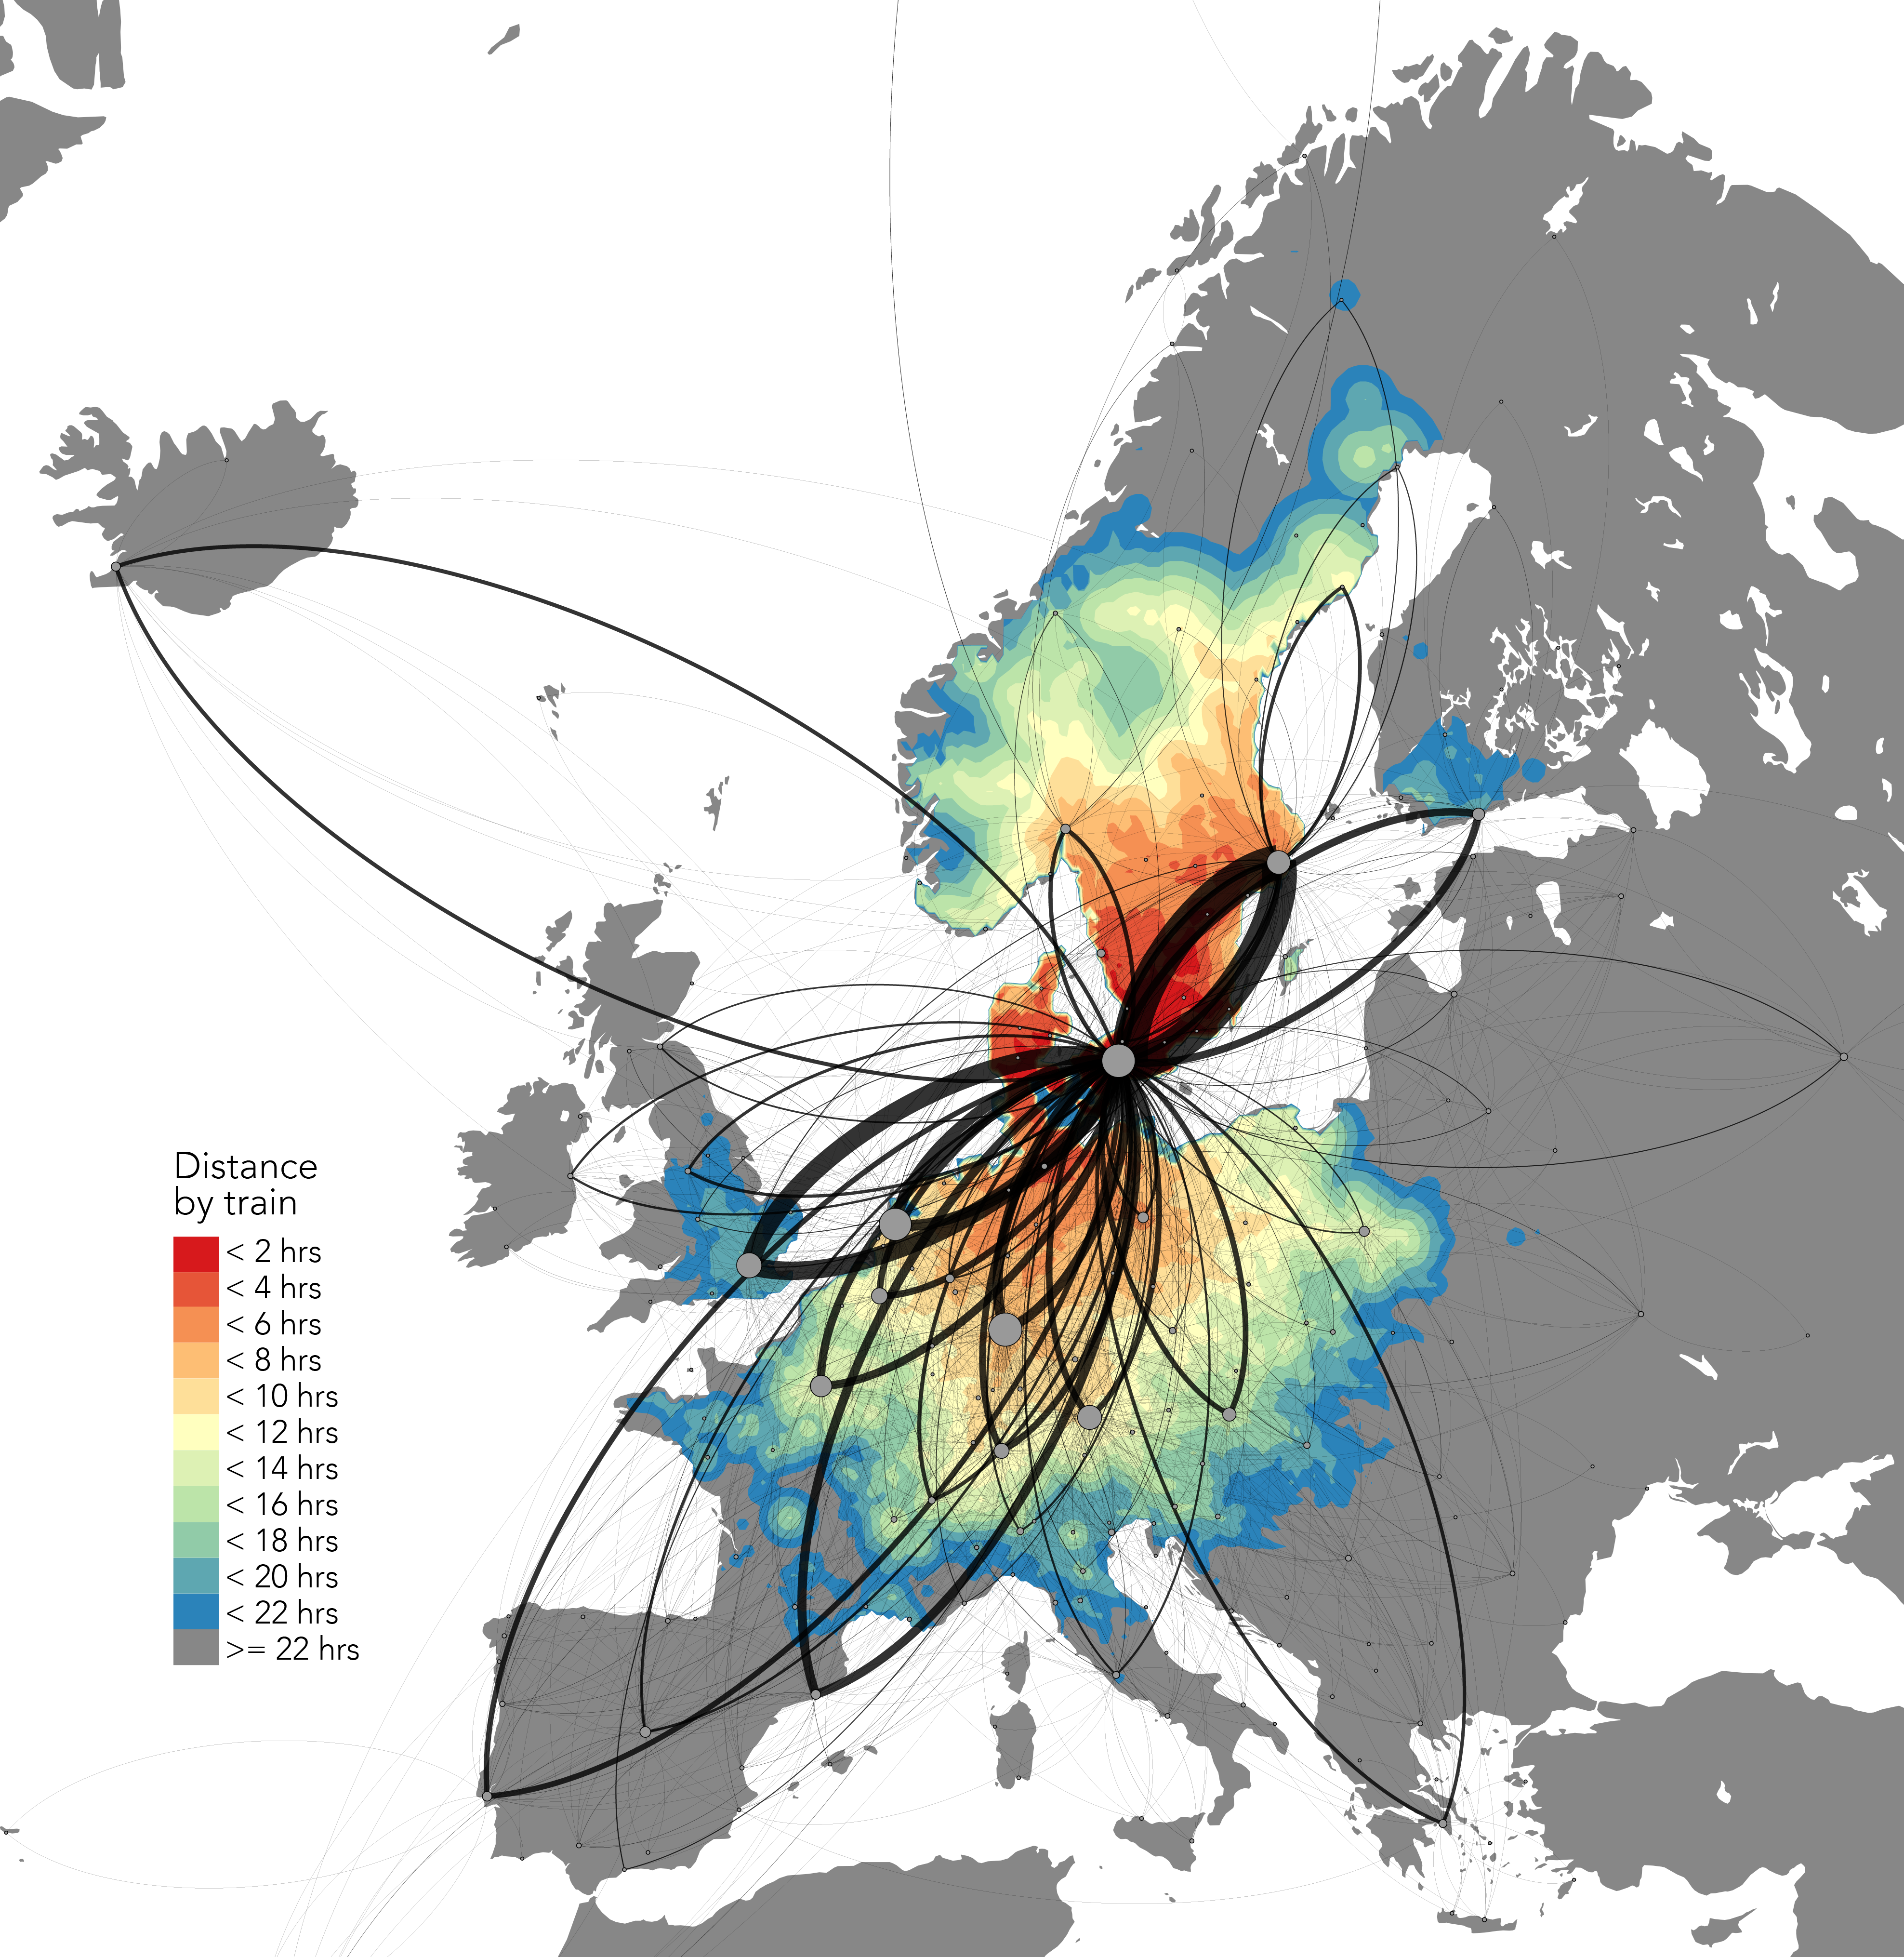
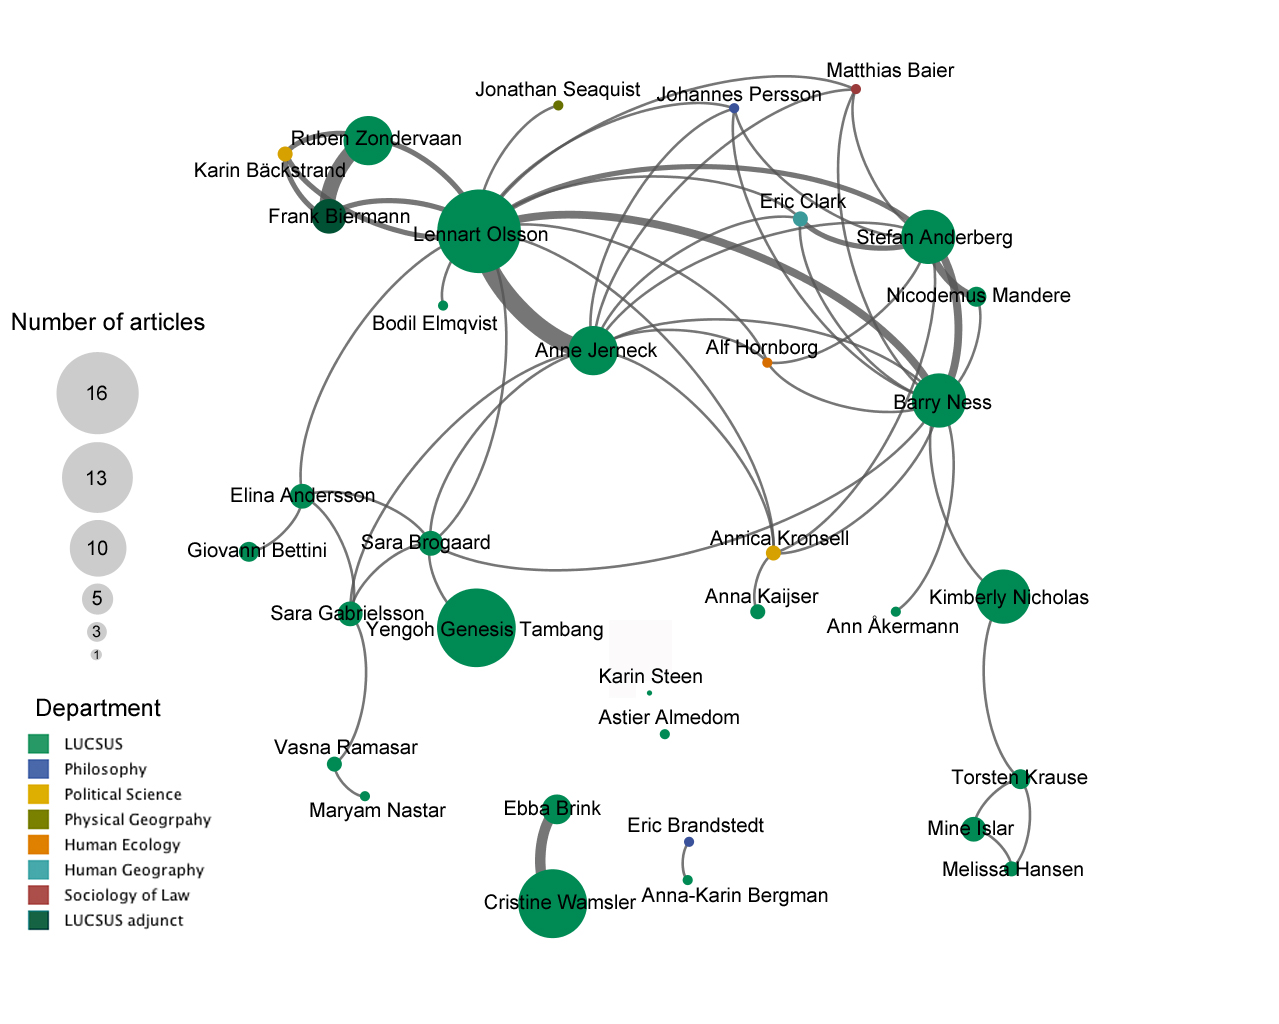
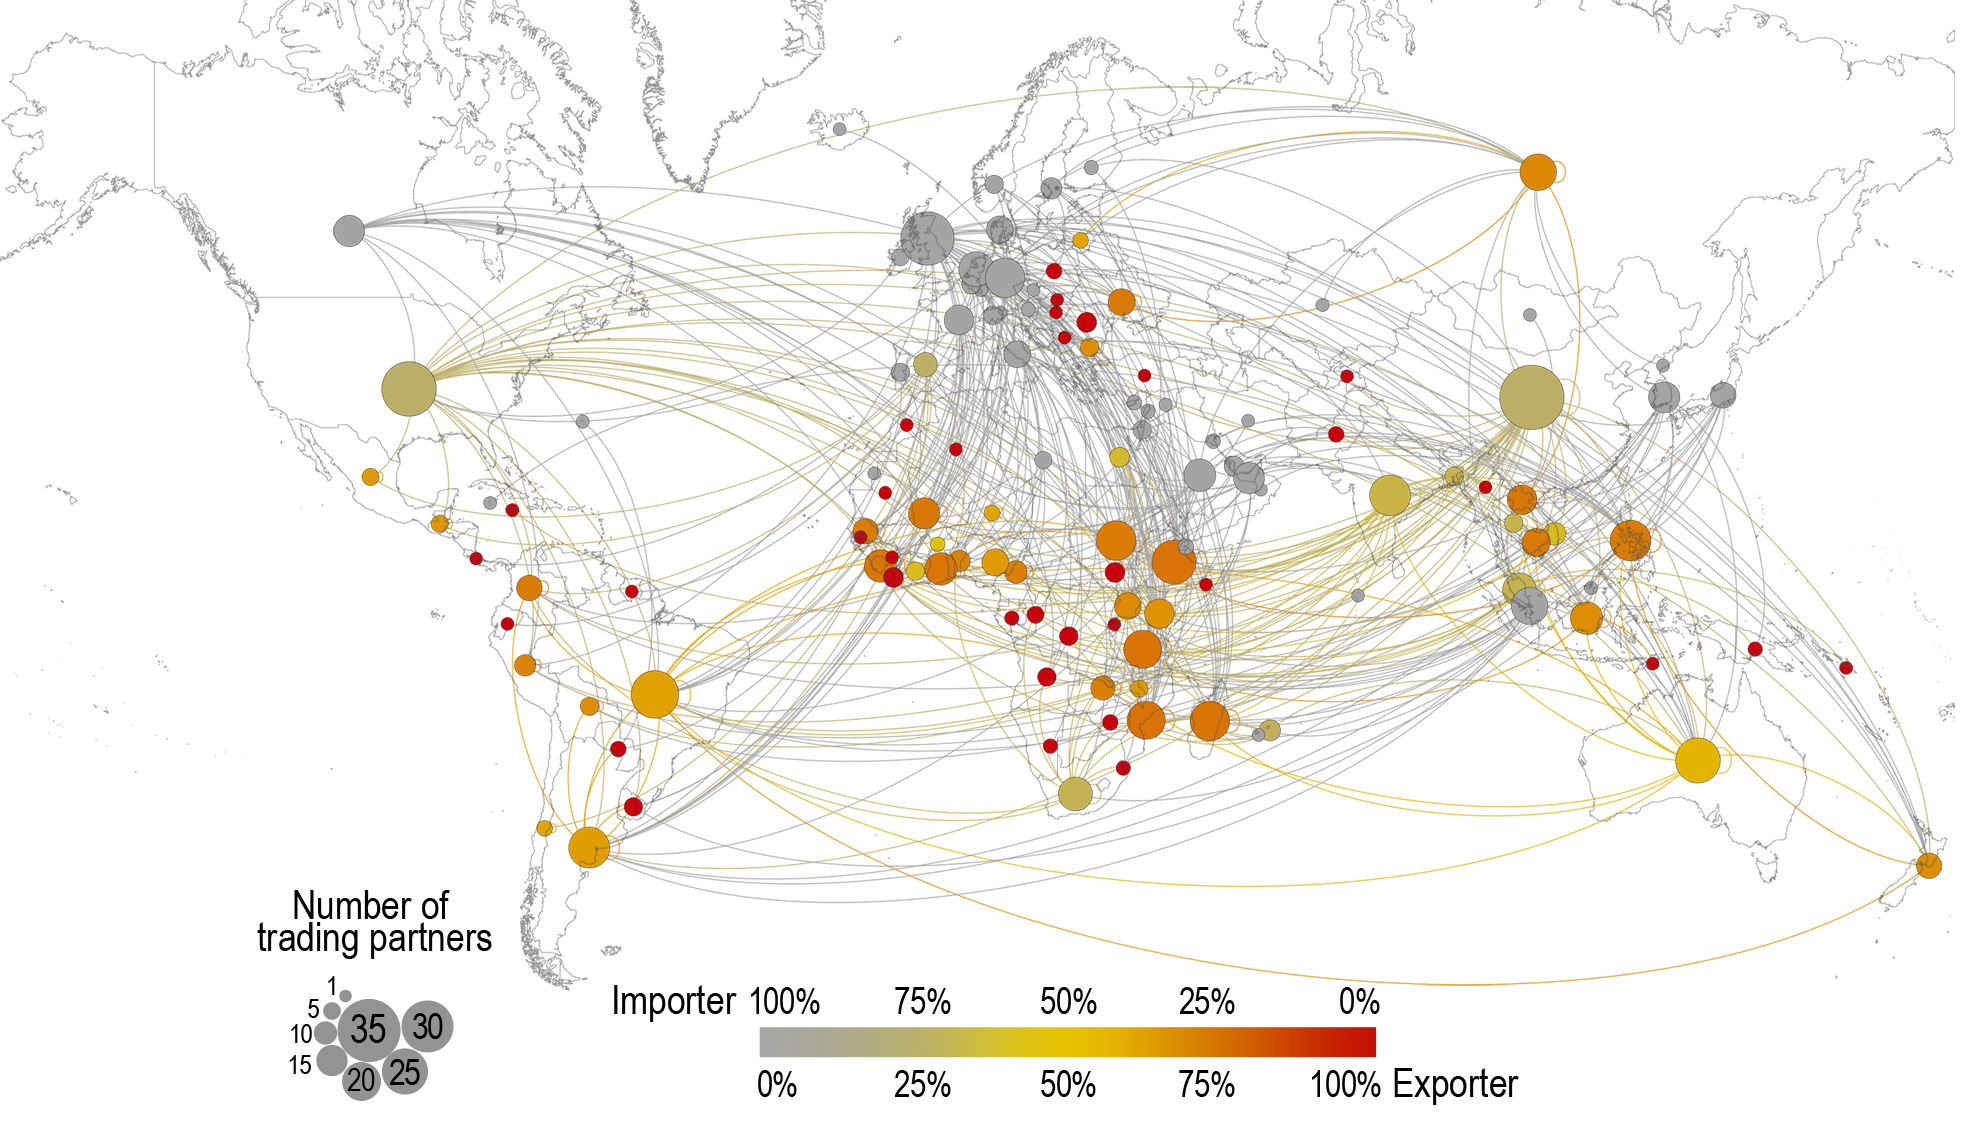
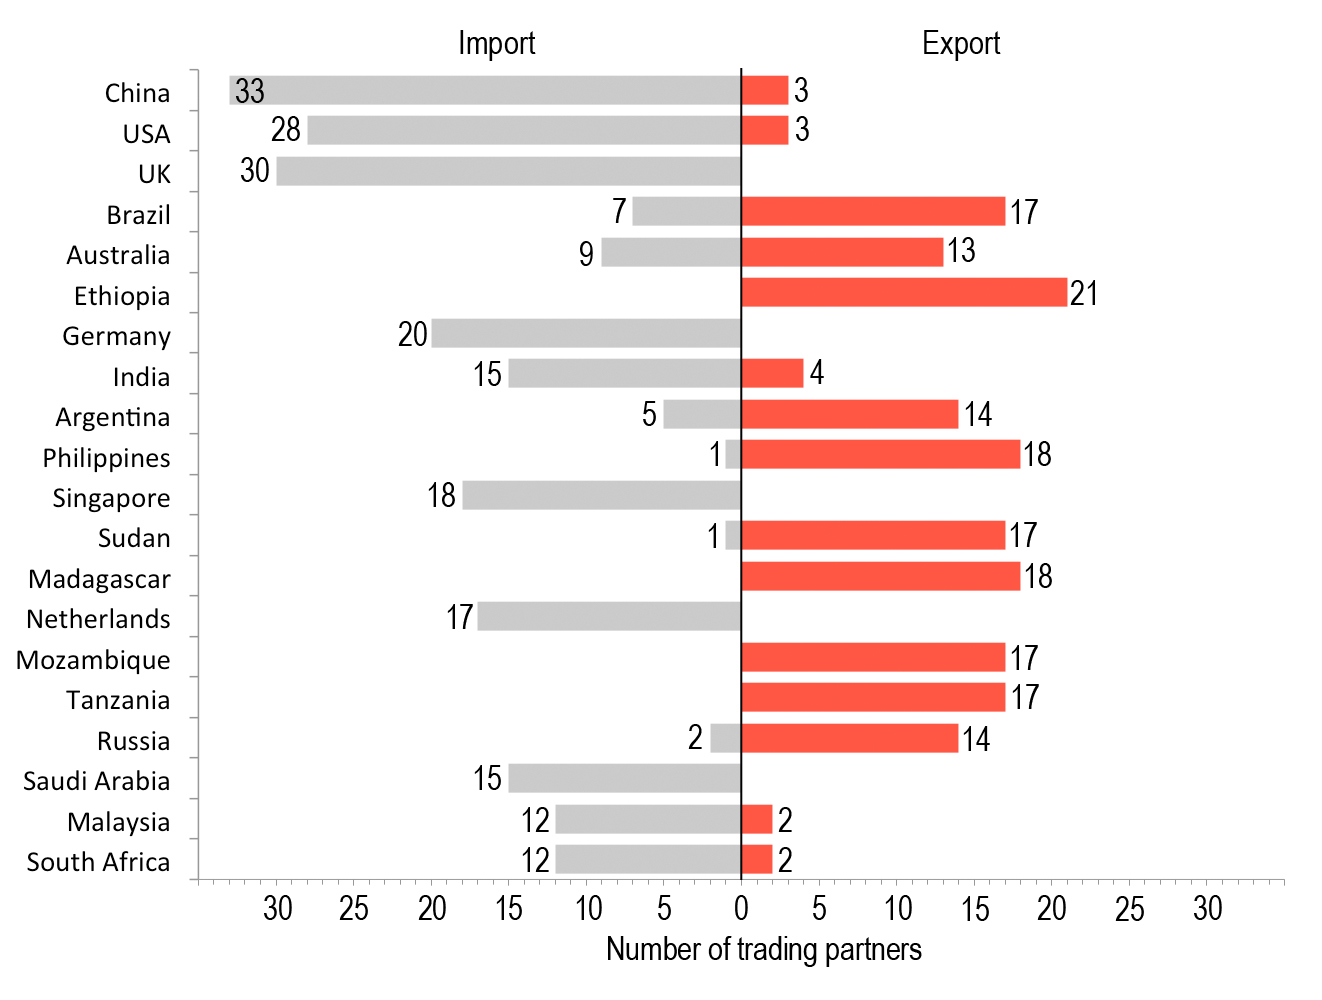
Network of countries engaged in large-scale land acquisitions, figure published in Seaquist et al. 2014. The figure was also covered by the Washington Post, and Vox.
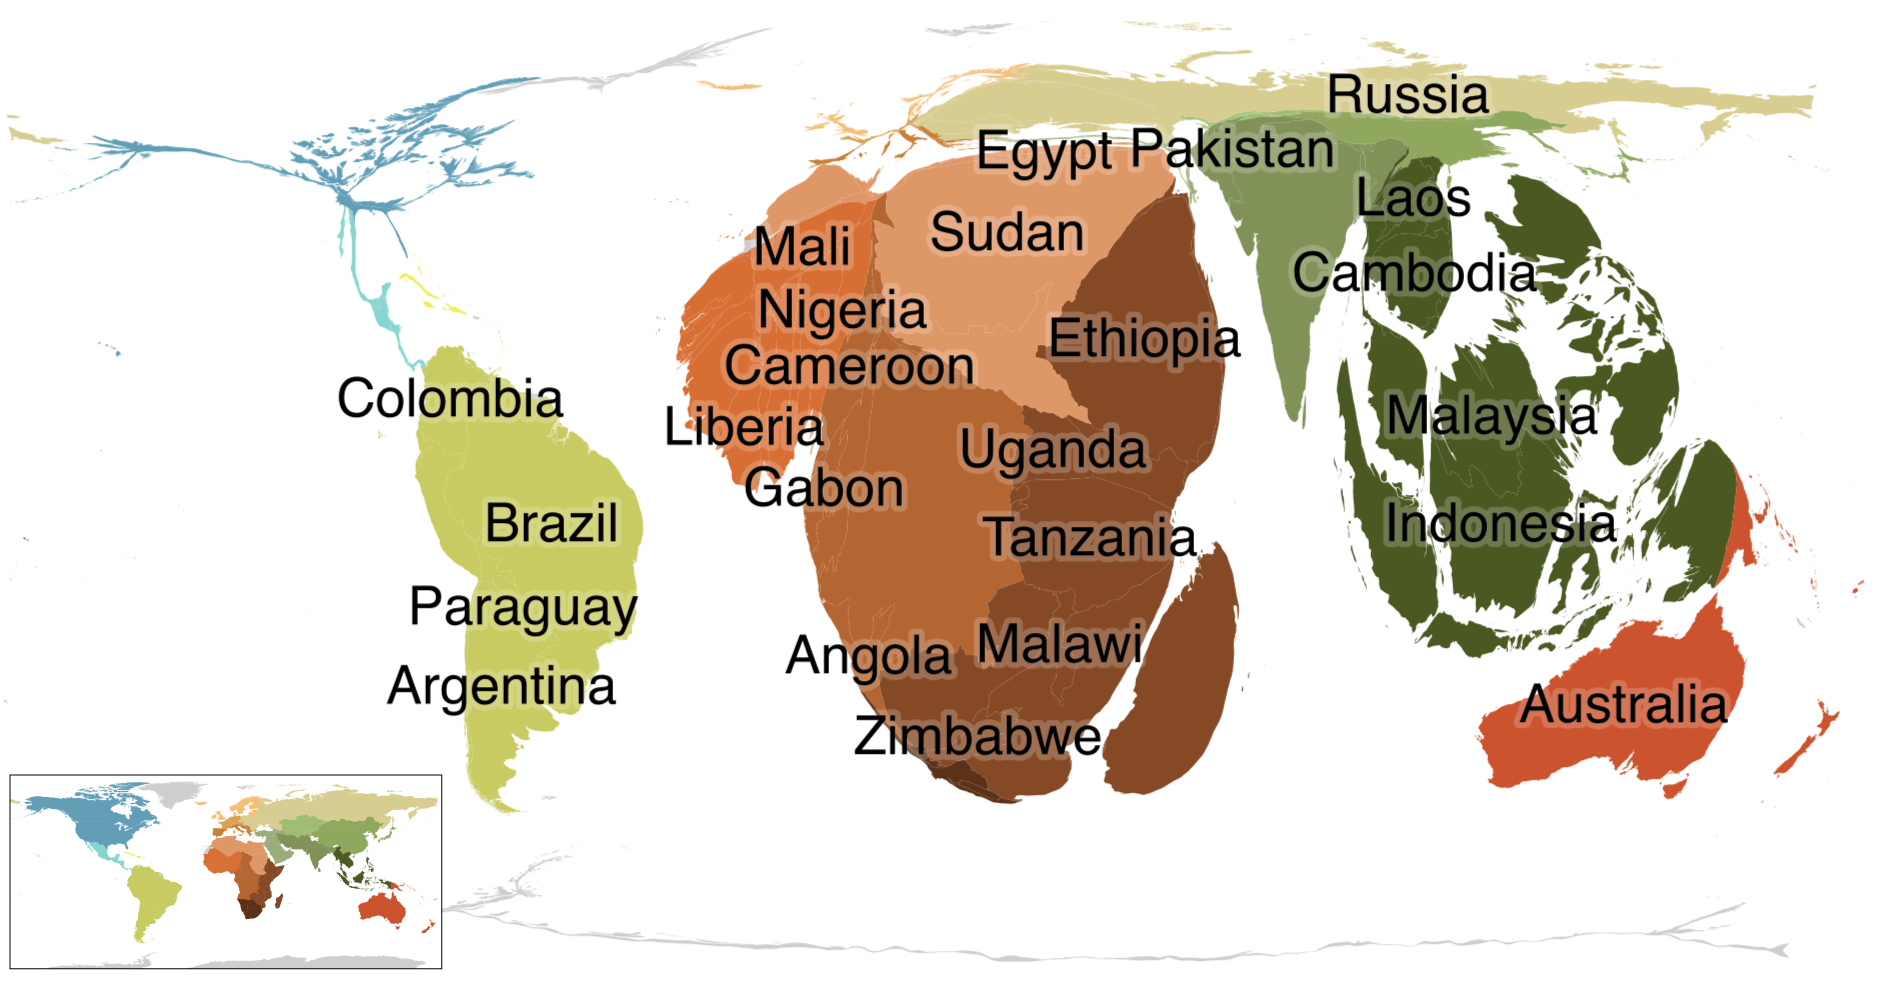
Countries engaged in large-scale land acquisitions, figure published in Seaquist et al. 2014.
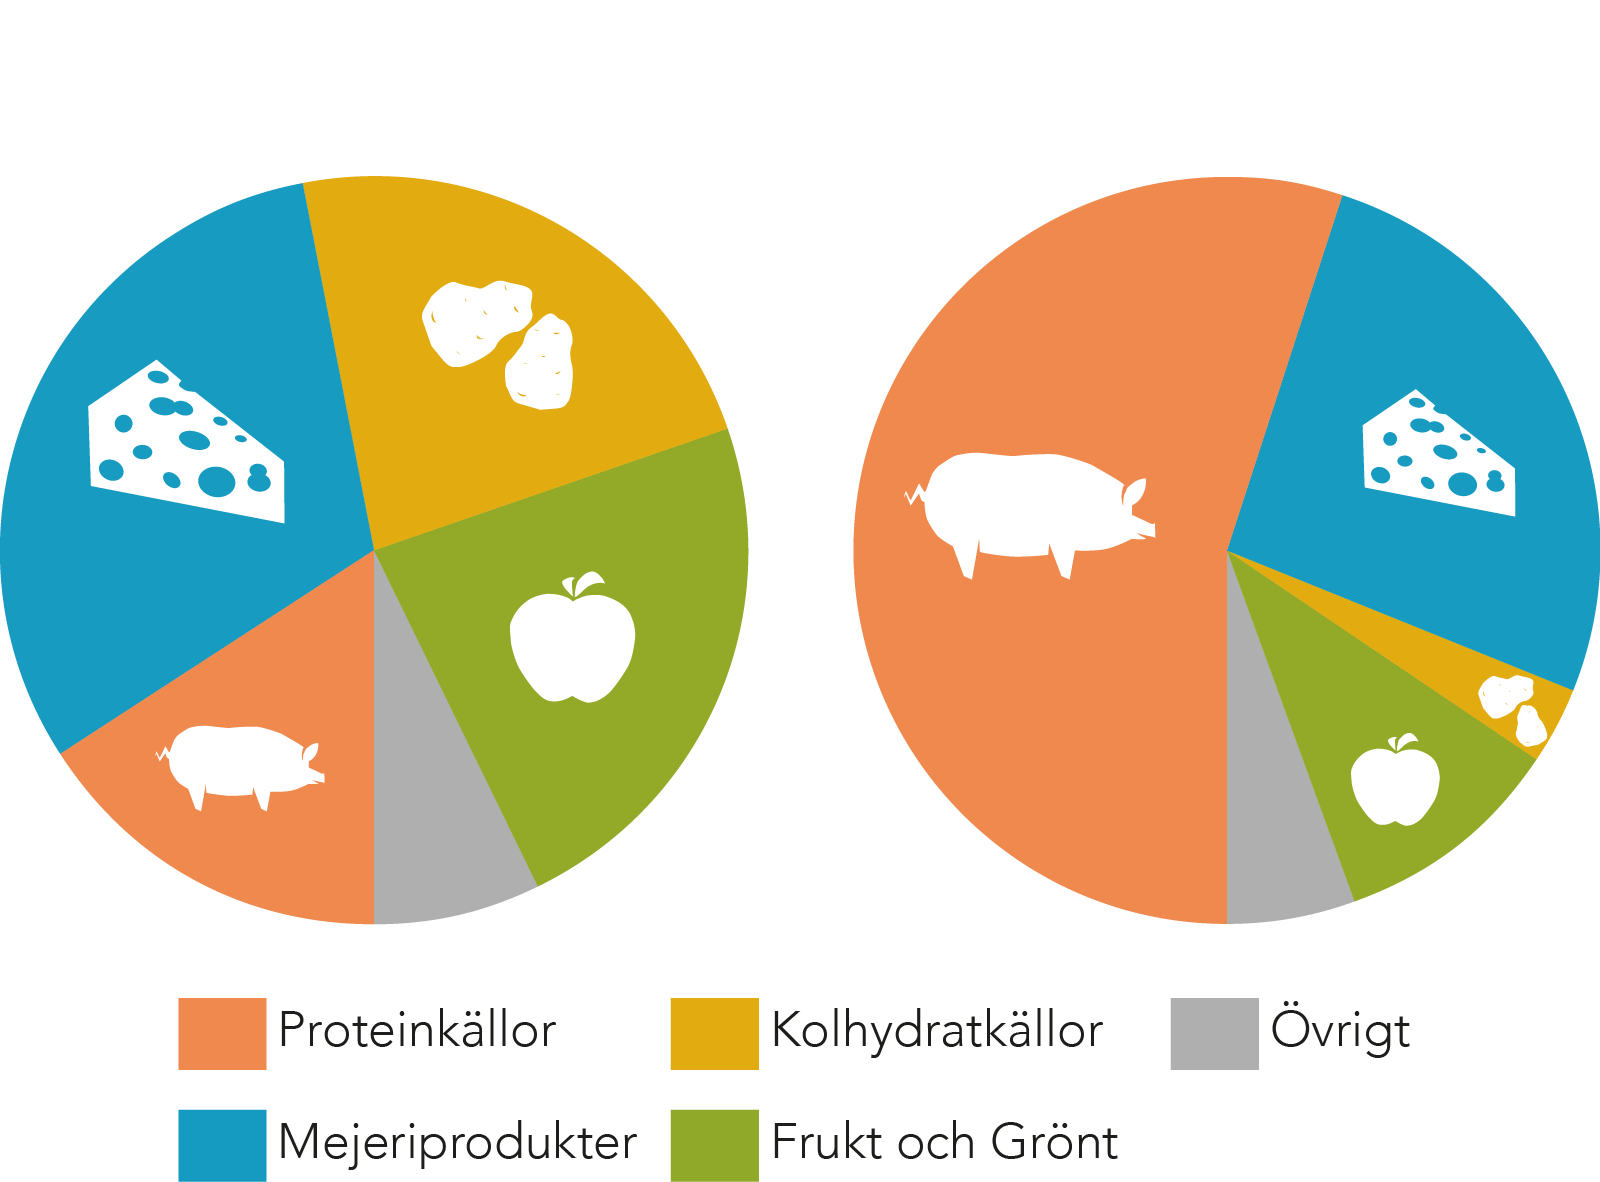
Illustration of a portion of food divided into different food types. The image to the left shows proportions in kilos, and the image to the right shows proportions of greenhouse gas emissions per portion. Illustrated for Miljömatematik.
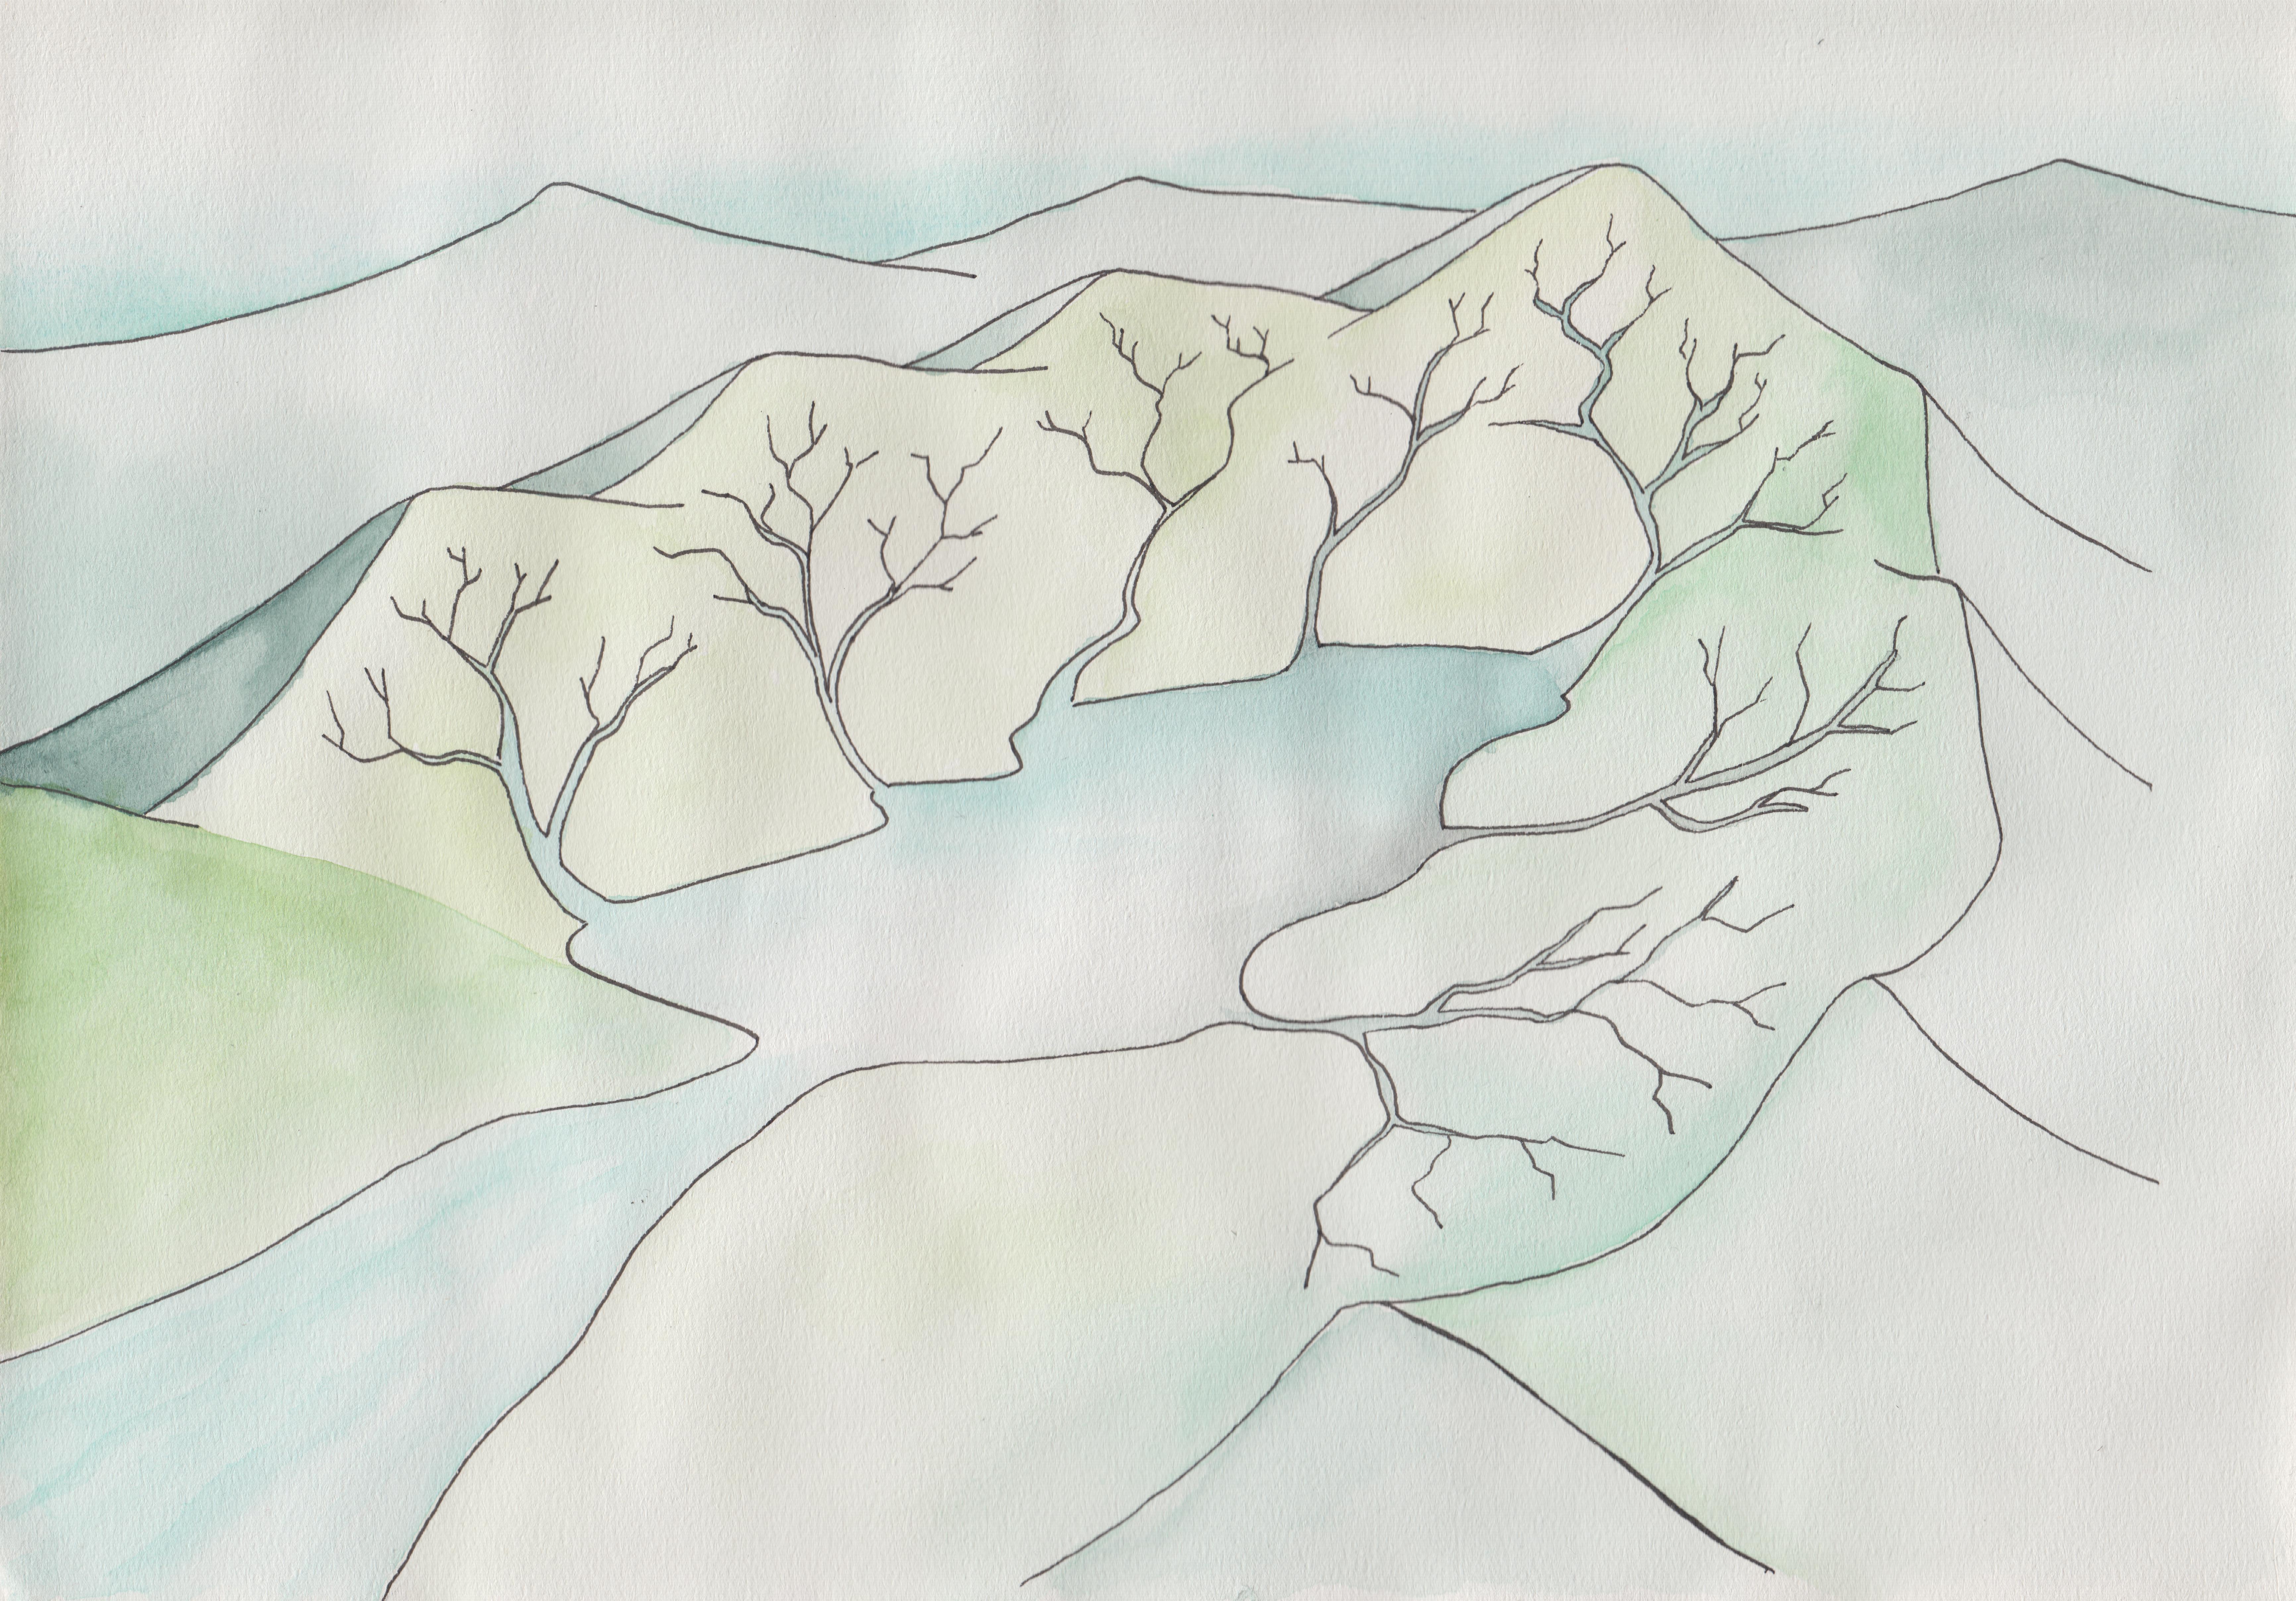
Illustration of a water catchment.
Stop-motion animation about land grabbing in a “Global North” setting. Unfinished work for WG Film, related to the documentary Dead Donkeys Fear no Hyenas.